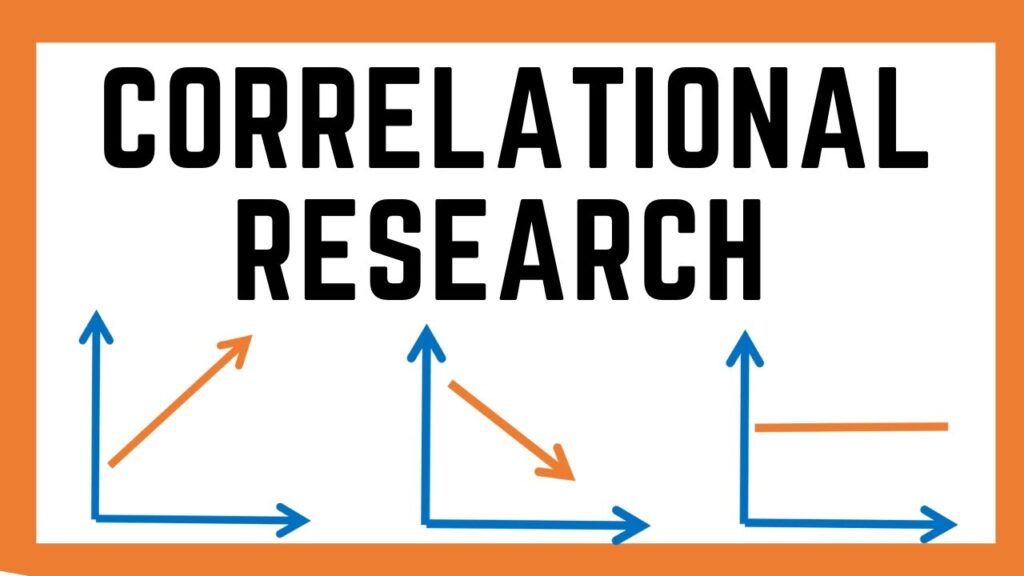
This article will take you through the types, pros and cons of correlational research. Also will discuss the data collection methods and the purpose of using correlational research.
Correlational research is a type of research that looks at the relationships between different variables. It can be used to study both cause and effect relationships. correlational research can be either positive or negative, depending on the direction of the relationship between the variables.
Correlational Research
Correlational research is a type of research that seeks to find a relationship between two variables. This research is often used to test hypotheses about how these variables are related.
Correlational research is a type of research that investigates the relationships between variables. It is used to examine how well one variable predicts another.
In correlational research,
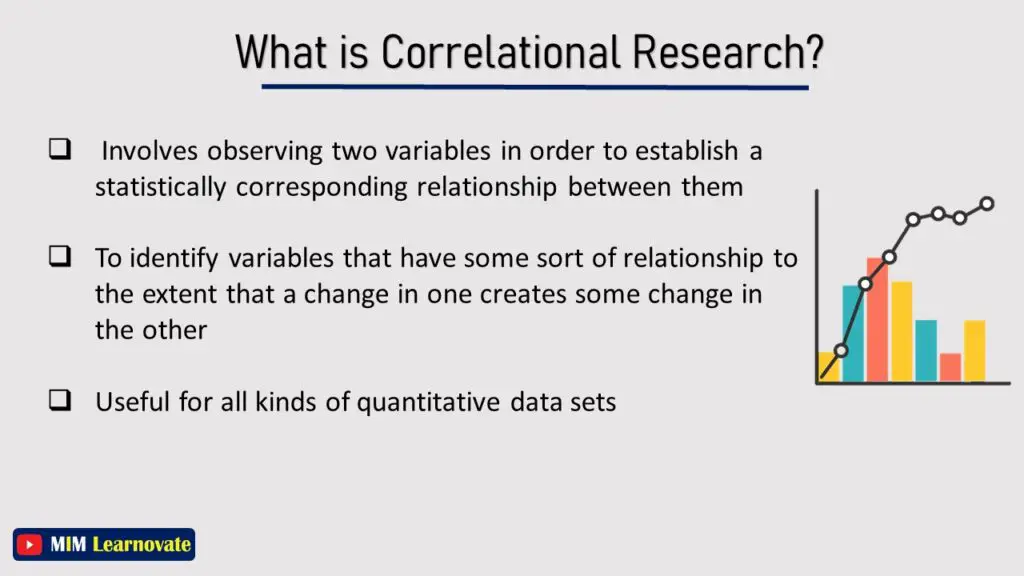
- Two variables are observed in order to determine whether there is a statistically significant link between them.
- Finding variables that are related in some way such that a change in one causes a change in the other is the goal of correlational research.
- All types of quantitative data sets benefit from the use of correlational research designs.
Example
To further comprehend correlational research, let’s look at one example.
Imagine that a scientist is looking into the relationship between cancer and anxiety. Cancer and Anxiety are the two variables in this study. Let’s imagine there is a positive correlation between cancer and anxiety. Therefore, those who have cancer experiences high levels of anxiety.
This does not necessarily imply that cancer creates feelings of anxiety, though. It is not possible to prove what causes what in correlational research.
Types of Correlational Research
There are three types of Correlational Research.
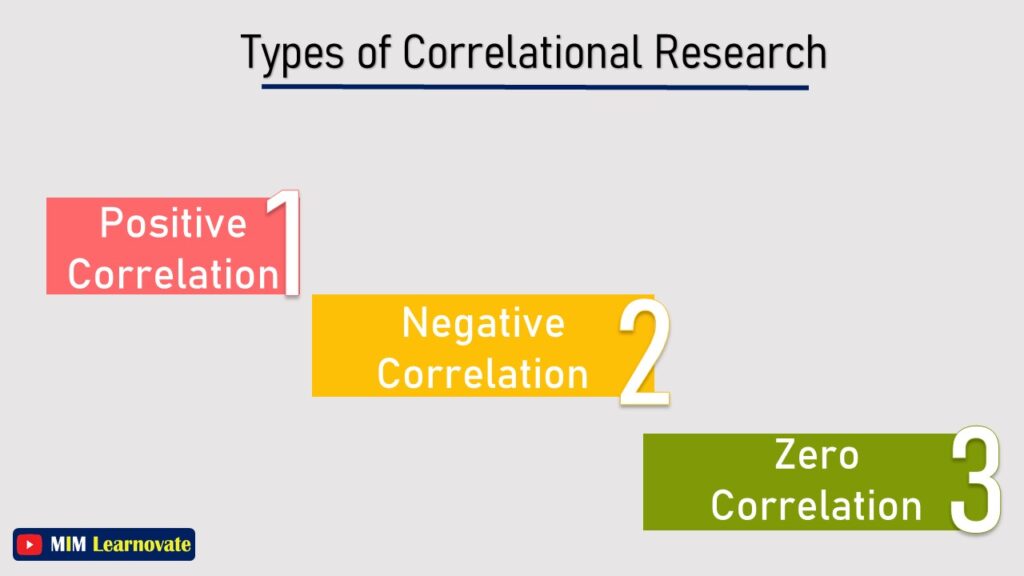
1. Positive Correlation
2.Negative Correlation
3. Zero Correlation
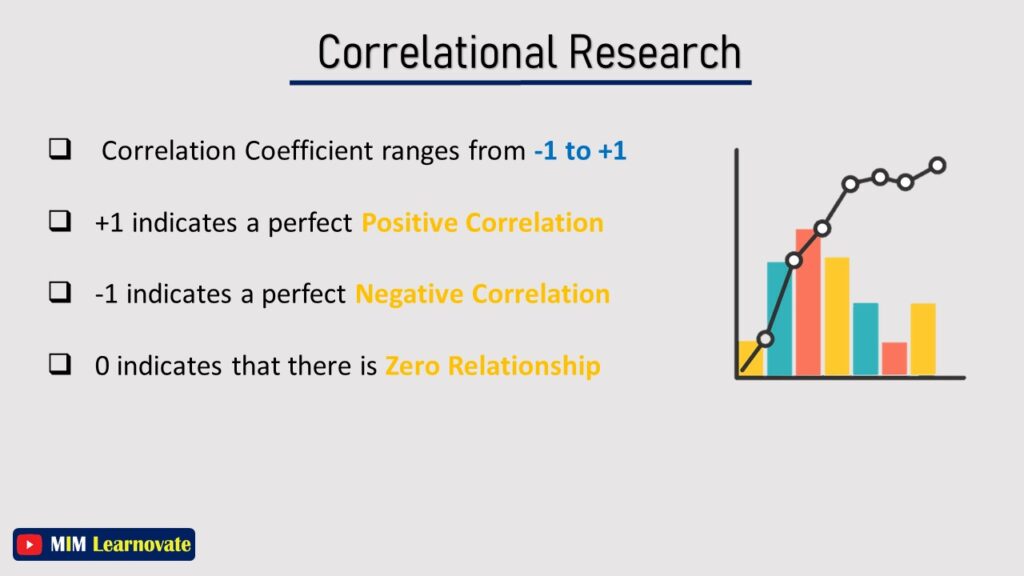
- Between -1 and +1 is the correlation coefficient range.
- A perfect positive correlation between two variables is shown by a correlation value of 1
- a perfect negative connection is indicated by a correlation coefficient of -1.
- If the correlation coefficient is 0, there is no correlation between the variables being studied.
Let’s study them in detail.
Positive Correlation
Positive correlational research examines how two variables are related in a linear fashion.
A positive correlation indicates that the two variables have a favorable association. As one variable increases in this kind of relationship, the other variable increases as well.
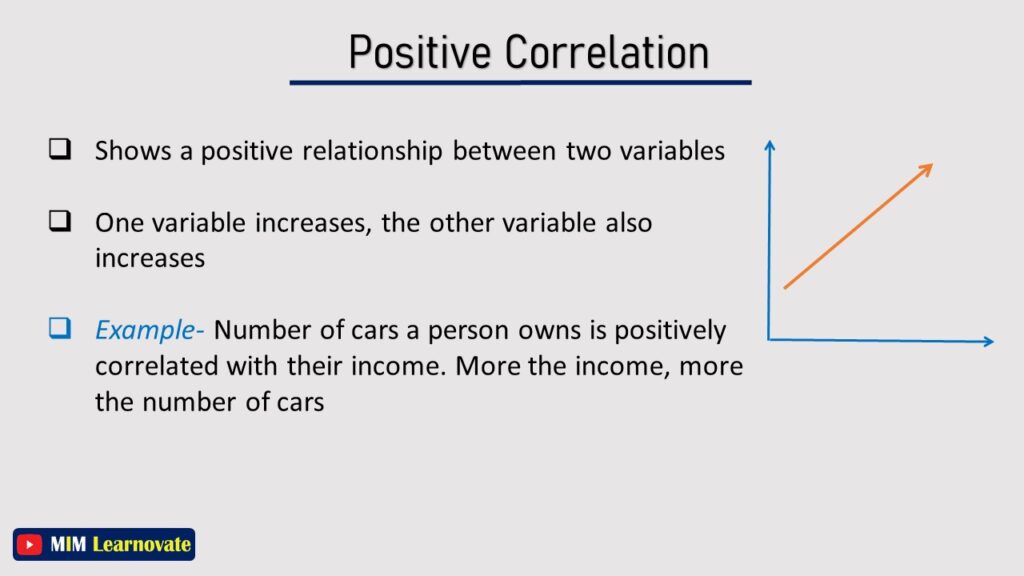
Example of Positive Correlation
For instance, a person’s salary and the size of the house they own are strongly associated. The more money a person makes, the huge house they own.
Negative Correlation
Negative correlational research looks at the relationship between two variables in an inverse fashion. A negative correlation indicates that the two variables do not correlate well. As one variable increases this type of correlation, the other variable decreases.
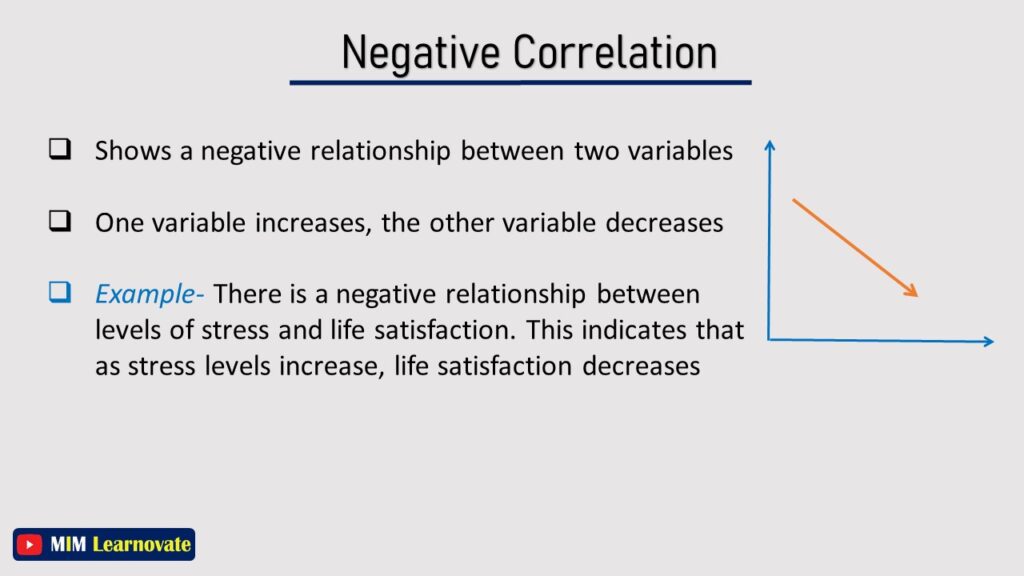
Example of Negative Correlation
For instance, stress levels and life satisfaction are negatively correlated. This suggests that life happiness decreases as stress levels rise.
Zero correlation
Zero correlation refers to the complete absence of any relationship between two variables. In statistics, this is represented by a correlation coefficient of zero. A zero correlation means that there is no linear relationship between the variables, and they do not change together.
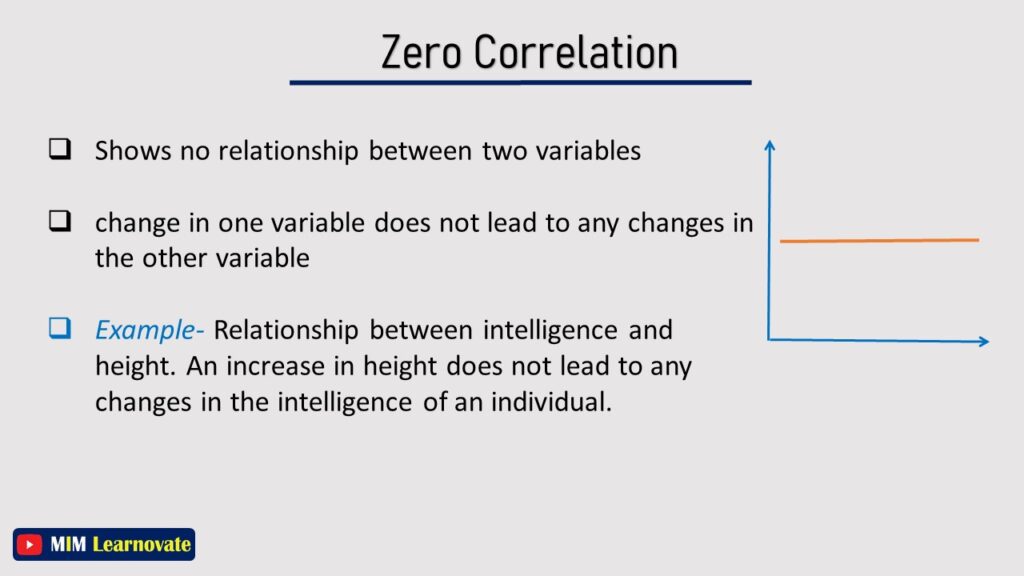
There is no relationship between the two variables, as indicated by a zero correlation. The other variable does not change when the first one does, and vice versa.
Example of Zero correlation
The link between intelligence and height is an illustration of zero correlation. There is no correlation between an individual’s weight and IQ.
Positive vs Negative vs Zero Correlation
Positive Correlation
Same direction of variables.
- More food consumed equals more weight gain.
- The likelihood of success improves with increased effort.
Negative Correlation
Opposite direction of variables.
- Corruption decreases when honesty rises.
- You can lose weight when you workout more.
Zero Correlation
No relationship between the variables.
- Obesity is not correlated with intelligence.
- Sugar has no relation with height.

When to Use Correlational Research?
1- Test new measurement instruments
You need to test the validity or reliability of the new instrument you built to measure your variable.
To determine whether an instrument regularly or accurately measures the notion it is intended to measure, correlational research might be utilized.
Example
Based on anecdotal evidence during lockdowns, you create a new scale to assess depression in adults. You must determine whether this scale is indeed assessing depression in order to validate it.
You gather information about depression using three different scales, including the new one, and test the strength of the degrees of correlations between them.
Finding strong correlations indicates the reliability of your scale.
2- Investigate the casual relationships between the factors
You believe there is a causal relationship between two factors, but conducting experimental research in which one of the variables is altered is unfeasible, immoral, or hugely expensive.
Research on correlations might offer preliminary cues or more evidence in support of theories on causal relationships.
Example
You want to look into whether emissions of greenhouse gases contribute to global warming. Although it is not realistic to conduct an experiment that continuously monitors global emissions, observation and analysis can demonstrate a substantial correlation that lends weight to the idea.
3- To look into non-causal relationships
Although you don’t expect to discover a causal connection between two variables, you want to determine whether there is an association between them.
Correlational analysis can shed light on intricate real-world linkages, assisting researchers in the creation of theories and forecasts.
Example
You’re interested in finding out if there’s a connection between people’s family size and the political party they support. You don’t believe that having more children affects how people vote; rather, you believe that other factors like age, religion, ideology, and socioeconomic status have a greater impact on both. However, a high correlation could be helpful in predicting voting trends.
Characteristics of Correlational Research
Dynamic
Correlational study shows that the relationships between two variables are never static and are constantly shifting. Due to numerous causes, two variables with a history of negative correlation studies may eventually show a positive correlation relationship.
Non-experimental
Correlational research is a non-experimental method. It implies that in order to support or refute a theory, researchers do not necessarily need to modify variables using a scientific technique. The variables are not changed or subjected to external conditioning; the researcher just measures and examines the connection between them.
Backward-looking
Correlational research solely considers historical information and keeps track of past events. It is measured and used by researchers to identify historical patterns between two variables. Although a correlational study may indicate a favorable association between two variables, this could change afterwards.
Pros of Correlational Research
The benefits of correlational research are listed below.
- You may examine the statistical link between the two variables with the aid of this research.
- Both the cost and the amount of time are lower.
- In a natural context, you can observe the variables.
- You can conduct this research instead of carrying out an experiment if you can’t.
- You are motivated by a variety of ideas that could aid in your future research.
- Large amounts of data can be gathered quickly.
Cons of Correlational Research
Additionally, correlational research has several drawbacks.
- Only capable of establishing a relationship between two variables, never more. So scope of this research is constrained.
- You can only learn a few things from this research. Finding the cause is not done; rather the relationships between variables are studied.
- It does not demonstrate a causal relationship between the variables. This means that it is unable to identify the variable that ultimately drives the statistical pattern.
- The variables are out of your control. You can only observe the variables and their statistical patterns with this method.
Data Collection method
Correlational research can be done in many different ways. The most typical data gathering techniques for this kind of research in the social and behavioral sciences include surveys, observations, and secondary data.
Naturalistic observation
Naturalistic observation is a method of data collection that involves observing people’s behavior where it naturally occurs, which is where they are most often found. This approach is a kind of field study. It could imply that a researcher is studying individuals in public spaces like a playground, movie theatre, or grocery store.
This approach of gathering data may be qualitative or quantitative. In order to avoid participants in the study being aware that they are being watched or otherwise deviating from being their authentic selves, researchers who are often involved in this form of data collecting make observations in the least intrusive manner feasible.
If the participants are kept anonymous and the study is carried out in a public setting, a place where individuals would not typically expect complete privacy, this method is ethically acceptable.
Example
As was previously indicated, let’s use the grocery store as an example, where shoppers may be seen gathering items from the aisle and placing them in their shopping bags. Since this is morally permissible, the majority of researchers decide to record their observations in open spaces.
Surveys
You can measure your key variables in survey research using questionnaires. You can conduct surveys in-person, over the phone, through the mail, or online.
Surveys are a quick and flexible way to gather standardized data from a large number of respondents, but it’s crucial to make sure your questions are framed objectively and capture the right insights.
Archival data
The usage of archival data is another method for handling correlational data. The data that has previously been gathered through conducting similar types of study is known as archival information. Primary research is typically used to make archival data accessible.
Archived data can provide information that is more easily understood than naturalistic observation.
Example
For instance, using social security information, it is easy to estimate the approximate number of Johns residing in each state in the United Kingdom.
Secondary data
You can use data that has already been obtained for a different purpose, such as official records, polls, or prior research, in place of collecting original data.
Because secondary data collection is thorough, using it is quick and cheap. However, you have no control over the validity or reliability of the data gathering methods, thus the data may be inaccurate, partial, or not totally relevant.
Example
You send a questionnaire on food to a sample of people from various income categories to see if there is a correlation between vegetarianism and income. To find out if vegetarians earn more on average, you statistically evaluate the responses.
How to analyze Correlational Data?
To conduct a correlational study and evaluate the statistical relationship between two variables, use the correlational research methods. After gathering data, you can statistically examine the correlation or regression between the variables, or perhaps both. A scatterplot is another tool for illustrating the correlations between variables.
Based on the levels of measurement and distributions of your data, many forms of correlation coefficient analysis and regression analyses are appropriate.
Correlational Analysis
A correlation coefficient, which is a single value that expresses the degree and direction of the association between variables, can be used to distil the relationship between variables using correlation analysis. You may measure how closely two variables are related by using this number.
The Pearson product-moment correlation coefficient, also referred to as Pearson’s r, is frequently used to determine if two quantitative variables have a linear relationship.
Although multiple correlation coefficients can be used for three or more variables, correlation coefficients are typically determined for two variables at a time.
Regression Analysis
You can estimate how much a change in one variable will affect a change in the other variable using a regression analysis. A regression equation that depicts the line on a graph of your variables is the end result.
By using the provided value(s) of the other variable, you can use this equation to forecast the value of one variable (s). The best course of action is to run a regression analysis following a correlation test on your variables.
Purpose of Correlational Research
- Finding links, describing these associations, and then making predictions are frequently the objectives of correlational research.
- Such studies frequently act as a springboard for additional experimental studies
Conclusion
In summary, it is possible to do correlational research in cases where experimental research is not feasible. It investigates the connection between two variables. Since it is dynamic, changes may occur at any time. You can quickly obtain data via correlational research. To ensure that your findings are legitimate and trustworthy, you can gather data using a variety of techniques.
Other articles
Please read through some of our other articles with examples and explanations if you’d like to learn more about research methodology.
Statistics
Methodology
- Research Methods
- Quantitative Research
- Qualitative Research
- Case Study Research
- Survey Research
- Conclusive Research
- Descriptive Research
- Cross-Sectional Research
- Theoretical Framework
- Conceptual Framework
- Triangulation
- Grounded Theory
- Quasi-Experimental Design
- Mixed Method
- Correlational Research
- Randomized Controlled Trial
- Stratified Sampling
- Ethnography
- Ghost Authorship
- Secondary Data Collection
- Primary Data Collection
- Ex-Post-Facto
Research
- Table of Contents
- Dissertation Topic
- Synopsis
- Thesis Statement
- Research Proposal
- Research Questions
- Research Problem
- Research Gap
- Types of Research Gaps
- Variables
- Operationalization of Variables
- Literature Review
- Research Hypothesis
- Questionnaire
- Abstract
- Validity
- Reliability
- Measurement of Scale
- Sampling Techniques
- Acknowledgements


