This article aims to explore the concept of a conceptual framework, its significance in research and examples.
Conceptual Framework
In the realm of research, a conceptual framework acts as a fundamental structure that supports the development and execution of a study.
It outlines the interrelated concepts, variables, and assumptions that guide the research process.
A conceptual framework helps researchers establish a clear path and ensures that their study aligns with existing knowledge and theories in the field.
A conceptual framework serves as a visual representation that outlines the anticipated relationships between variables in a research study. It plays a crucial role in defining the objectives of the research process and providing a structured framework for drawing coherent conclusions.
It is advisable to construct your conceptual framework prior to initiating the data collection phase. Conceptual frameworks are commonly depicted in a visual format and showcase cause-and-effect relationships. As you determine the topic of your paper, thesis, or dissertation, you can begin conceptualizing and developing the framework.
Developing a strong conceptual framework is essential to ensure the clarity and coherence of your research study. By mapping out the relationships between variables and establishing the objectives, you can effectively guide your research process and arrive at meaningful conclusions.
Remember, constructing an effective conceptual framework is a crucial step in conducting research, and it should be done prior to collecting data.
How to make a conceptual framework?
A successful conceptual framework design comprises the following components:
- Making the right research question choices
- The dependent, independent, and other process variables are defined.
- Identifying the cause-and-effect relationships
The first step in using this analytical tool is to specify the best possible set of questions that the research hopes to address at its conclusion. The different variables are then categorized.
Finally, a thorough data analysis is performed on the data collected. To create relationships between the variables, final results are compiled.
The quality of the research as a whole is impacted by the factors depicted inside the frames. Arrows in the framework indicate correlational relationships between the variables.
On the other hand, lines imply that there is no real relationship between them. Therefore, it is important to consider the meaning that both lines and arrows indicate while using them.
Developing a Conceptual Framework
A conceptual framework is a valuable tool that aids in understanding and representing the expected relationships between variables, characteristics, or properties under study. It can be presented in either written or visual form, and its development is typically informed by an extensive review of existing literature on the chosen research topic.
Step 1: Defining the Research Question
The research question forms the foundation of your study, providing a clear focus and direction. For instance, suppose you wish to explore whether there is a correlation between the number of study hours and students’ exam scores. Before delving into data collection, it is essential to construct a conceptual framework that outlines the variables to be measured and their expected relationships.
Step 2: Identifying Independent and Dependent Variables
To investigate cause-and-effect relationships, it is crucial to identify the independent and dependent variables. In our example, the independent variable would be “hours of study,” acting as the predictor or explanatory variable, while the dependent variable would be “exam score,” serving as the response or outcome variable.
In this case, the hypothesis suggests that increased study hours positively impact exam scores.
It is worth noting that causal relationships often involve multiple independent variables influencing the dependent variable. However, for simplicity, we will focus on a single independent variable (“hours of study”) in this example.
Step 3: Visualizing the Cause-and-Effect Relationship
Once the research question and variables have been determined, the next step is to visually represent the expected cause-and-effect relationship within the conceptual framework. This can be achieved using simple design components such as boxes and arrows.
Conceptual Model with independent and dependent variable

Each variable is represented in a box, with arrows denoting causal relationships, starting from the independent variable (cause) and pointing towards the dependent variable (effect).
Step 4: Identifying Other Influencing Variables
In order to ensure the accuracy and completeness of your research, it is essential to identify other variables that may influence the relationship between the independent and dependent variables. These variables can include moderating, mediating, and control variables.
Moderating Variables
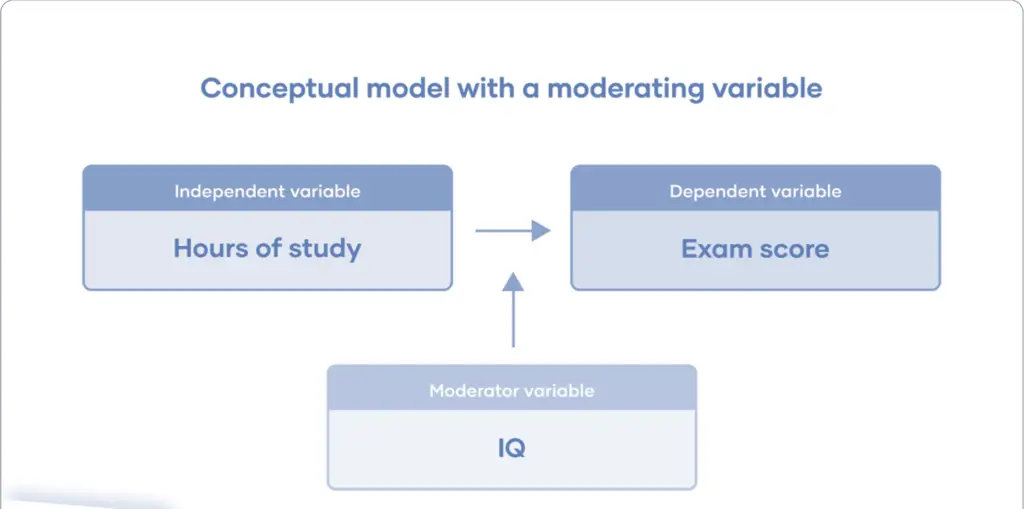
Moderators alter the effect of an independent variable on a dependent variable. They essentially modify the cause-and-effect relationship.
For example, let’s introduce the moderating variable “IQ.” In this case, a student’s IQ level may influence the impact of study hours on exam scores. Higher IQ levels might require fewer study hours to achieve better results. Thus, we expect the “IQ” moderator to moderate the effect of study hours on exam scores.
Conceptual Model with Moderating Variables

Mediating Variables
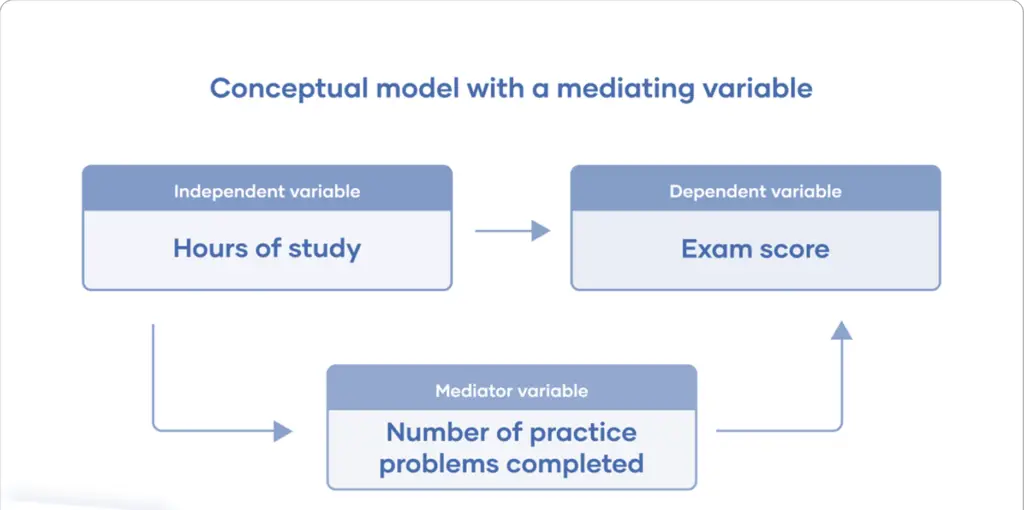
To further expand the conceptual framework, we can add mediating variables. Mediators play a crucial role in connecting the independent and dependent variables, providing a deeper understanding of the relationship between them.
Example: Mediator Let’s consider the mediating variable of “number of practice problems completed” between the independent and dependent variables. In this case, the hours of study have an impact on the number of practice problems completed, which, in turn, influences the exam score.
Conceptual Model with Mediating Variables
The conceptual framework incorporating a mediator variable may look as follows:

In this scenario, the mediator variable helps explain why studying more hours leads to higher exam scores. Increased study hours result in a greater number of practice problems being completed, subsequently leading to improved exam performance.
Control Variable
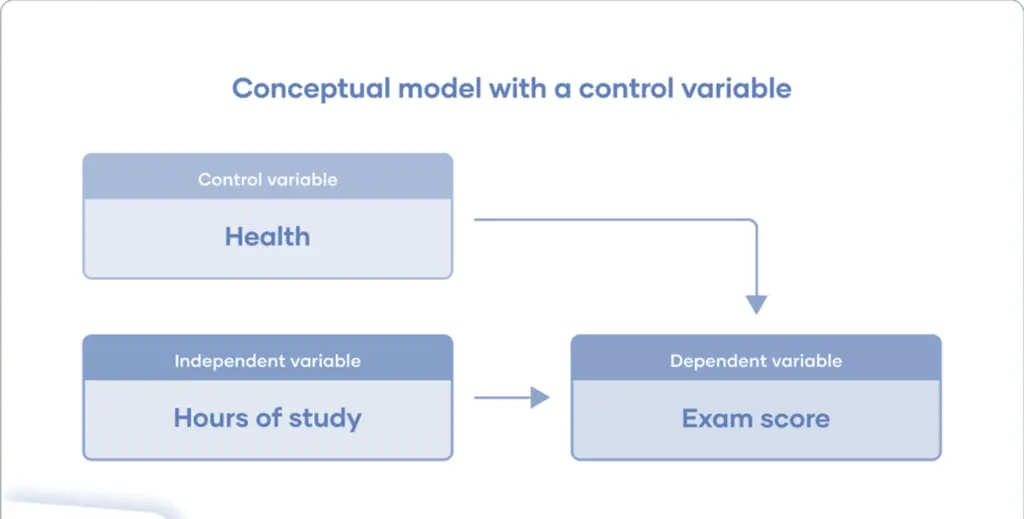
Additionally, it is crucial to account for control variables in the research study. These variables are held constant to prevent interference with the results. While they may not be the primary focus of the study, being aware of as many control variables as possible is essential.
Example: Control Variable For instance, if a student feels unwell on the day of the exam, it could potentially impact their exam score. However, health outcomes are not the main focus of our research study.
In this case, “health” becomes a suitable candidate for a control variable. Although it still influences the results, it is not the variable of interest.
We can incorporate “health” into the conceptual framework while keeping it constant. This means that only participants who are in good health on the day of the exam will be included in the study.
Conceptual Model with Control Variable

Other articles
Please read through some of our other articles with examples and explanations if you’d like to learn more about research methodology.
Citation Styles
- APA Reference Page
- MLA Citations
- Chicago Style Format
- “et al.” in APA, MLA, and Chicago Style
- Do All References in a Reference List Need to Be Cited in Text?
Comparision
- Basic and Applied Research
- Cross-Sectional vs Longitudinal Studies
- Survey vs Questionnaire
- Open Ended vs Closed Ended Questions
- Experimental and Non-Experimental Research
- Inductive vs Deductive Approach
- Null and Alternative Hypothesis
- Reliability vs Validity
- Population vs Sample
- Conceptual Framework and Theoretical Framework
- Bibliography and Reference
- Stratified vs Cluster Sampling
- Sampling Error vs Sampling Bias
- Internal Validity vs External Validity
- Full-Scale, Laboratory-Scale and Pilot-Scale Studies
- Plagiarism and Paraphrasing
- Research Methodology Vs. Research Method
- Mediator and Moderator
- Type I vs Type II error
- Descriptive and Inferential Statistics
- Microsoft Excel and SPSS
- Parametric and Non-Parametric Test
Comparision
- Independent vs. Dependent Variable – MIM Learnovate
- Research Article and Research Paper
- Proposition and Hypothesis
- Principal Component Analysis and Partial Least Squares
- Academic Research vs Industry Research
- Clinical Research vs Lab Research
- Research Lab and Hospital Lab
- Thesis Statement and Research Question
- Quantitative Researchers vs. Quantitative Traders
- Premise, Hypothesis and Supposition
- Survey Vs Experiment
- Hypothesis and Theory
- Independent vs. Dependent Variable
- APA vs. MLA
- Ghost Authorship vs. Gift Authorship
Research
- Research Methods
- Quantitative Research
- Qualitative Research
- Case Study Research
- Survey Research
- Conclusive Research
- Descriptive Research
- Cross-Sectional Research
- Theoretical Framework
- Conceptual Framework
- Triangulation
- Grounded Theory
- Quasi-Experimental Design
- Mixed Method
- Correlational Research
- Randomized Controlled Trial
- Stratified Sampling
- Ethnography
- Ghost Authorship
- Secondary Data Collection
- Primary Data Collection
- Ex-Post-Facto
Research
- Table of Contents
- Dissertation Topic
- Synopsis
- Thesis Statement
- Research Proposal
- Research Questions
- Research Problem
- Research Gap
- Types of Research Gaps
- Variables
- Operationalization of Variables
- Literature Review
- Research Hypothesis
- Questionnaire
- Abstract
- Validity
- Reliability
- Measurement of Scale
- Sampling Techniques
- Acknowledgements
Statistics
- PLS-SEM model
- Principal Components Analysis
- Multivariate Analysis
- Friedman Test
- Chi-Square Test (Χ²)
- T-test
- SPSS
- Effect Size
- Critical Values in Statistics
- Statistical Analysis
- Calculate the Sample Size for Randomized Controlled Trials
- Covariate in Statistics
- Avoid Common Mistakes in Statistics
- Standard Deviation
- Derivatives & Formulas
- Build a PLS-SEM model using AMOS
- Principal Components Analysis using SPSS
- Statistical Tools
- Type I vs Type II error
- Descriptive and Inferential Statistics
- Microsoft Excel and SPSS
- One-tailed and Two-tailed Test
- Parametric and Non-Parametric Test


