

In this article, you will learn about Measurement of Scale with the help of examples and PPT. Also, you will get an idea about the importance of Measurement of Scale.
In research, it is important to be clear about the Measurement of Scale you are using. The level of measurement refers to the quality of the data. Levels of measurement refer to the way in which variables are quantified.
There are four measurement of scales. Each scale has its own strengths and weaknesses, and the level of measurement should be chosen based on the research question being asked. It has different characteristics and uses in research.
Measurement of Scale
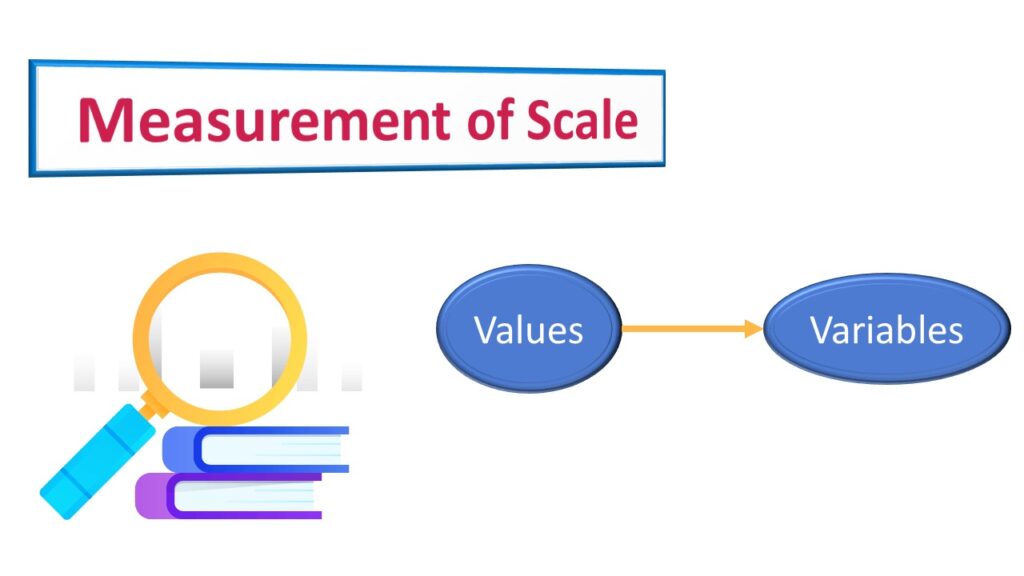
In any research study, it is important to consider the level of measurement for the variables under study. The Measurement of Scale refers to the relationship between the values assigned to objects and their attribute.
Level of measurement or scale of measure is a classification that describes the nature of information within the values assigned to variables.
Measurement of Scale is how you measure your data and is a way to label data for analysis. Researcher can specify the level of measurement as
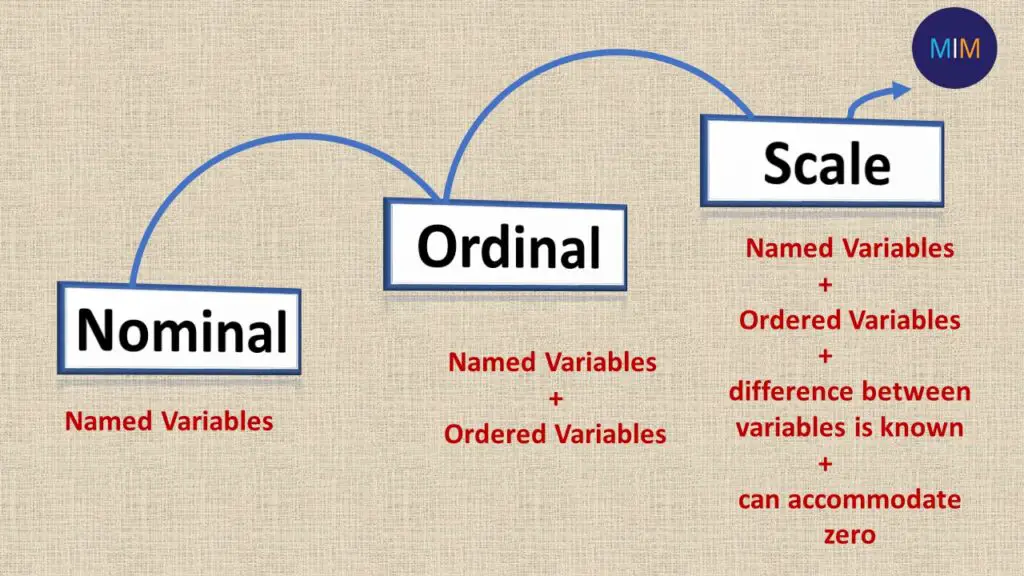
- Nominal
- Ordinal
- Scale
It is required to define the variables on the basis of nominal, ordinal or scale. In the primary research, a questionnaire contains questions related to different variables. Some variables can be nominal, ordinal or scale depending on their nature.
Example
Consider the following variables
- name
- qualification
- age
- gender
- performance
- stress
- experience
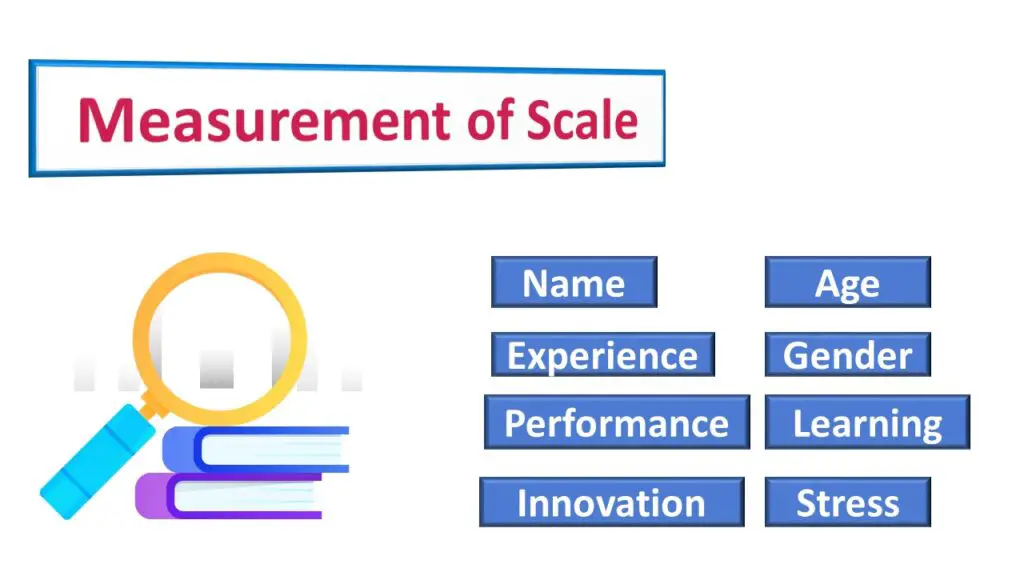
All above variables are different by nature, some are numeric, string or alphanumeric.
Some of the variables cannot be ranked, some can be ranked but cannot be quantified by any unit of measurement. While some can be ranked as well as can be quantified.
Each of those variables will be measured using nominal, ordinal or scale which will be discussed in detail in this article.
Types of Measurement of Scale
There are four Measurement of scales nominal, ordinal, interval, and ratio. Interval data have equal intervals between values but no true zero point. Ratio data have a true zero point.
Nominal
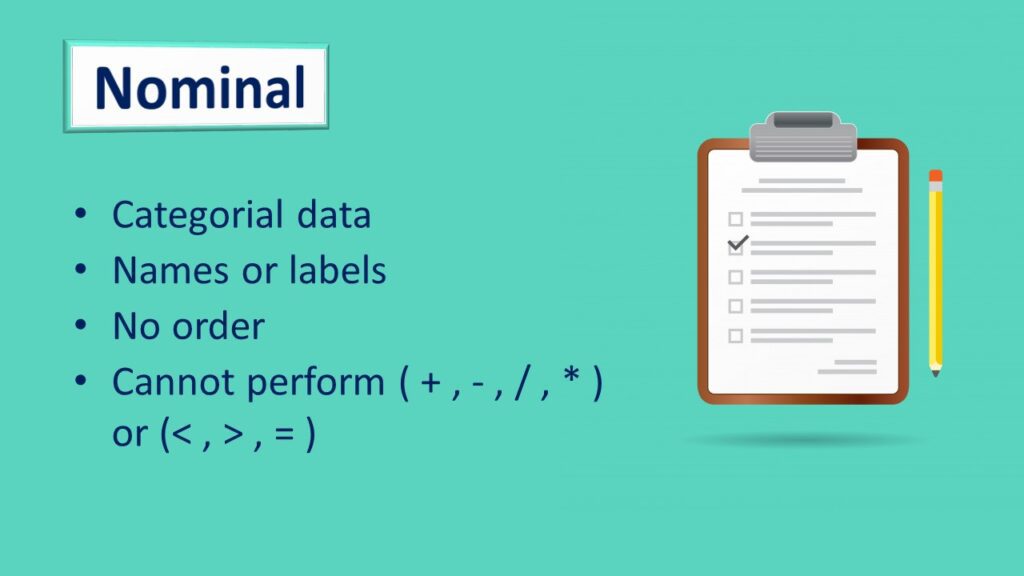
Nominal scale is categorical data are used for labeling variables, without any quantitative value. This data can only be categorized.
- Nominal scales are kind of like “names” or labels.
- This data has no order.
- You cannot perform arithmetic (+, – , *, / ) or logical operations (<,>,=) on the nominal data.
Example
1- While filing out the survey you see questions like
| What’s your name? |
| What is your qualification? |
| What is your experience? |
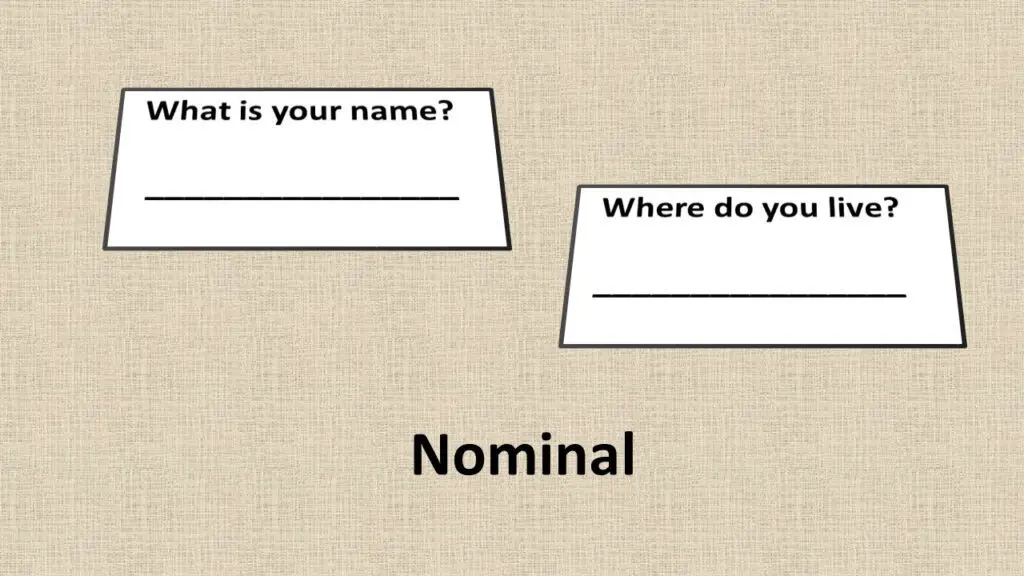
The answer you get is in string so this kind of data is nominal.
2- Similar is the case with gender.
| What is your Gender? |
| Male |
| Female |
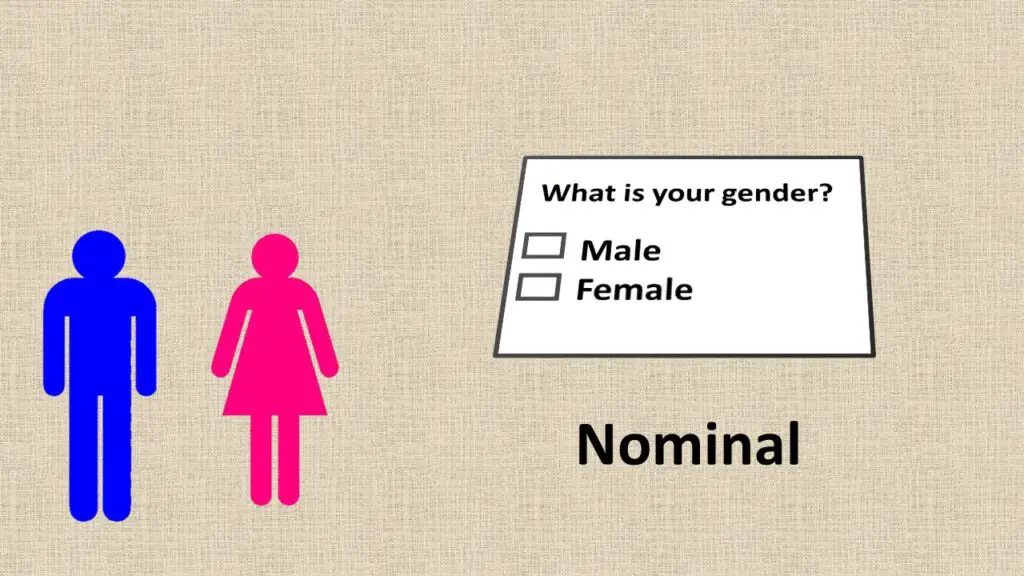
The data you get is in string which cannot be added or subtracted because they are just names or labels.
So all these variables are nominal because these variables don’t have any numeric value.
Ordinal
Ordinal data is also categorial data which is placed into some kind of order by their position on the scale. This data can be ranked.
This type of data are typically measures of non-numeric concepts like satisfaction, happiness, discomfort, etc.
With ordinal scales, the order of the values is what’s important and significant, but the differences between each one is not really known.
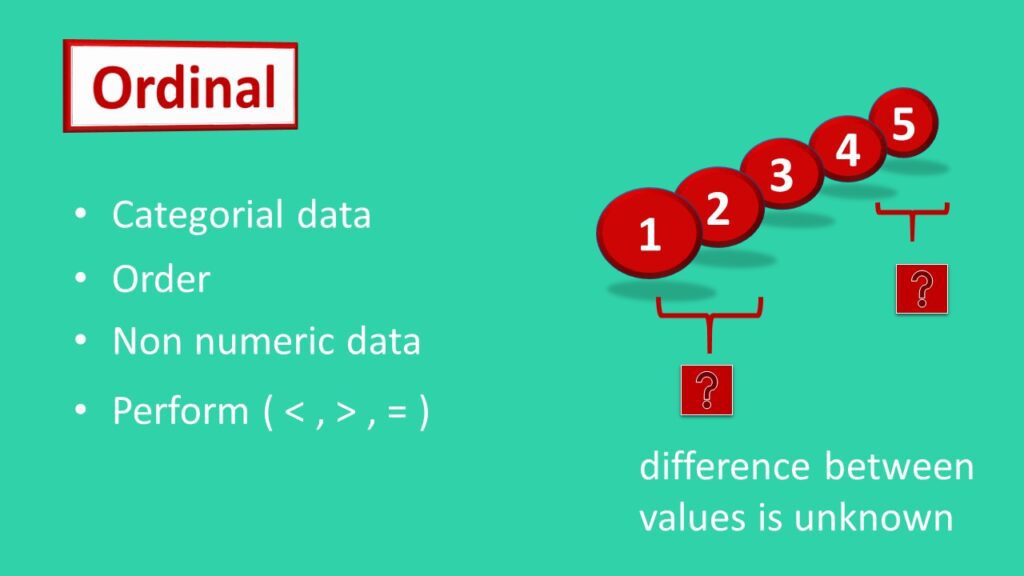
Ordinal data can perform logical operations. It is often used to measure attitudes and perceptions.
Likert-type scales such as on a scale of 1 to 5, with one being strongly disagreed and five being Strongly agreed represent ordinal data.

Example
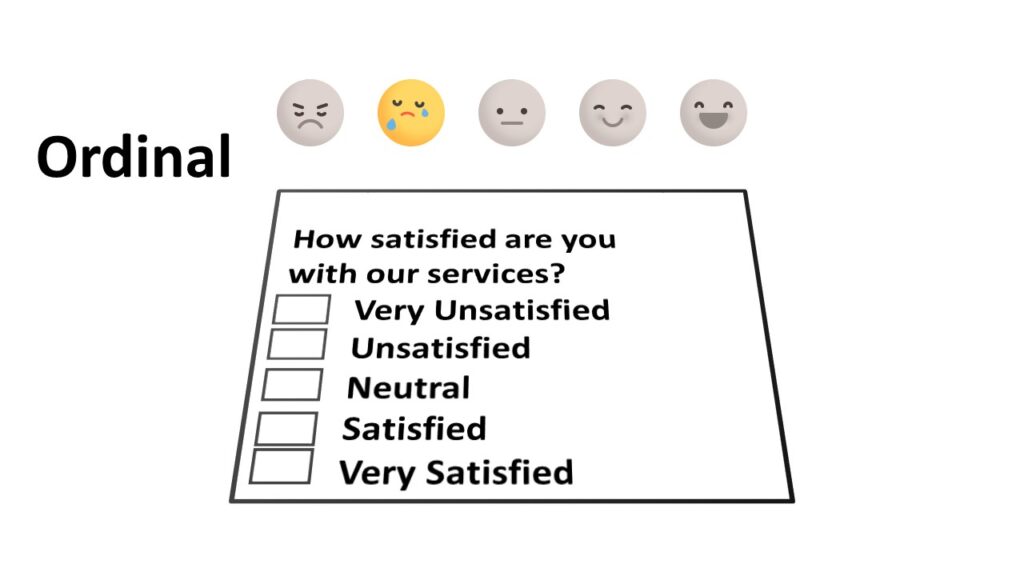
A survey may ask how satisfied a customer on 5 point Likert scale from very satisfied to very dissatisfied.
| How satisfied are you with our products? |
| 1- Very Unsatisfied |
| 2- Unsatisfied |
| 3- Neutral |
| 4- Satisfied |
| 5- Very Satisfied |
This data is ordinal since it is unknown whether the intervals between each values are equal on a 5 point scale.
The difference between dissatisfied and very dissatisfied is not perceived to be same as difference between very satisfied and satisfied.
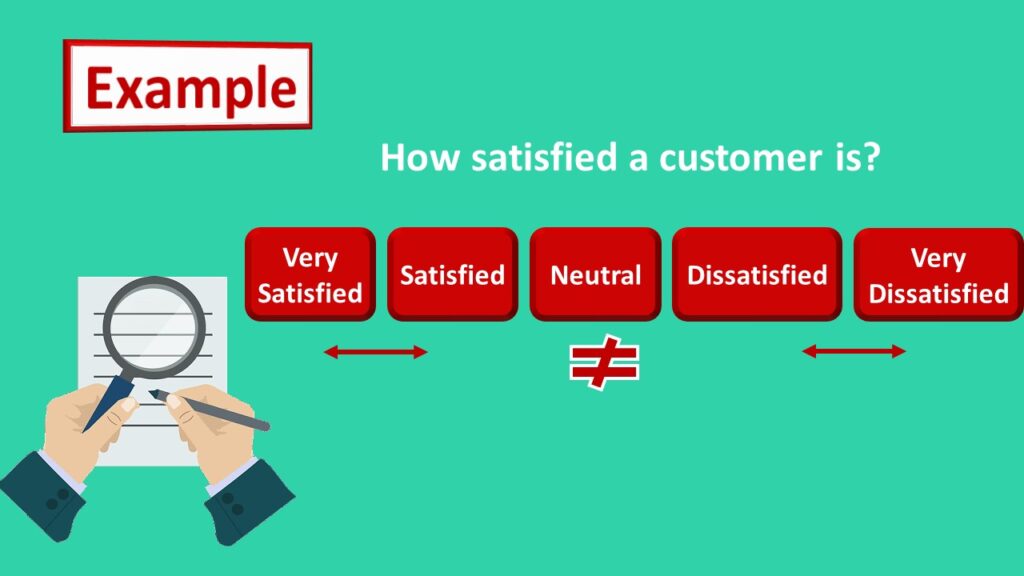
- The order and labelling are critical in this case.
- Very dissatisfied is always worse than dissatisfied, and satisfied is always worse than very satisfied.
- This is where ordinal scale is superior to nominal scale – the order is important, as is the naming of the outcomes.
- Analyzing findings based on order and name becomes a simple process for the researcher.
- You can use the ordinal scale if they want to collect more information than they would with a nominal scale.
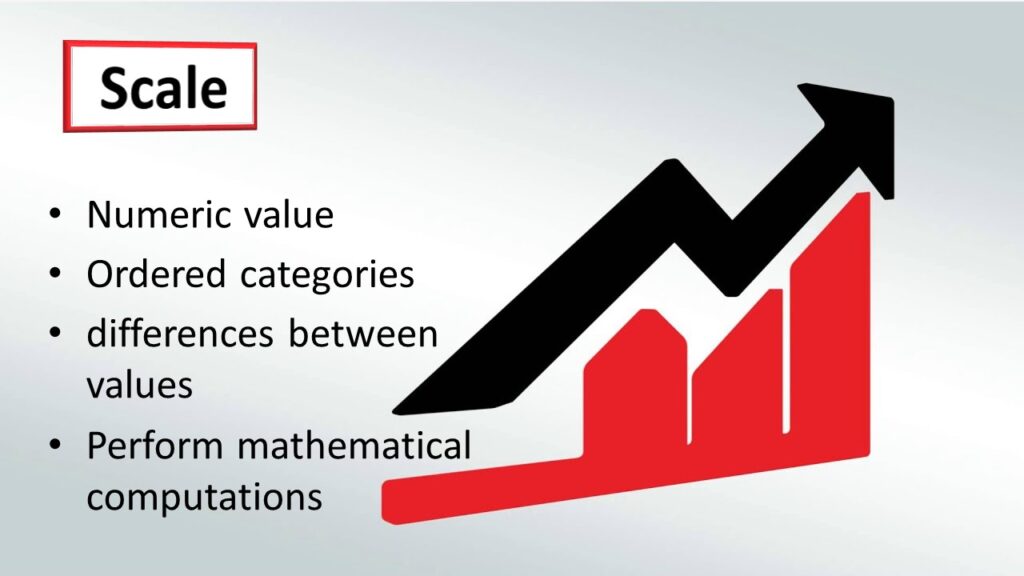
Scale
A scale variable is a variable that has a numeric value. A variable can be treated as scale when its values represent ordered categories with a meaningful metric, so that distance comparisons between values are appropriate. It can perform mathematical computations.
Two types of Scale data are:
- Interval
- Ratio
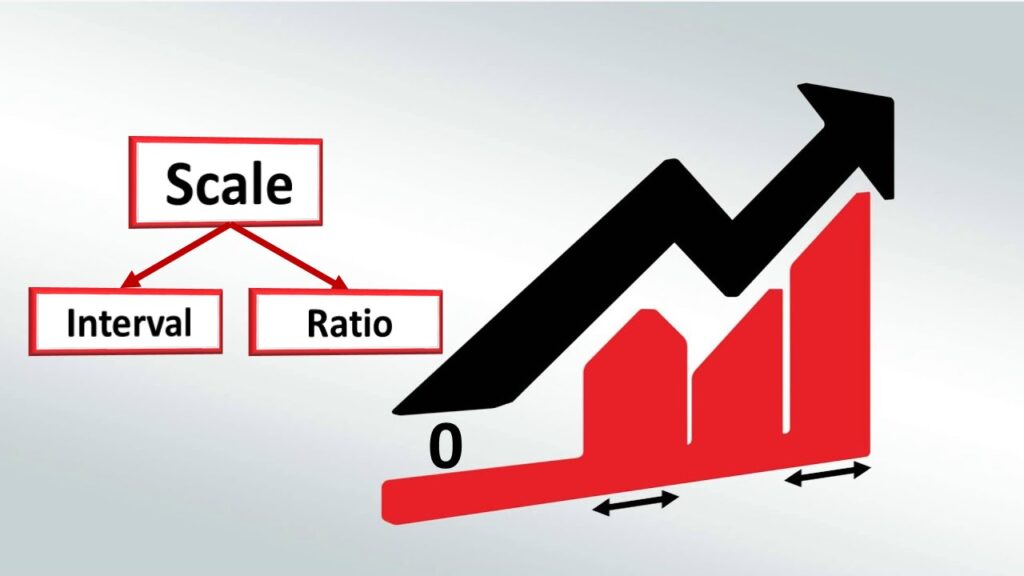
Interval and ratio are often treated as one – Scale
A scale that categorizes and rank orders item, has equal intervals and a zero that means nothing is being measured.
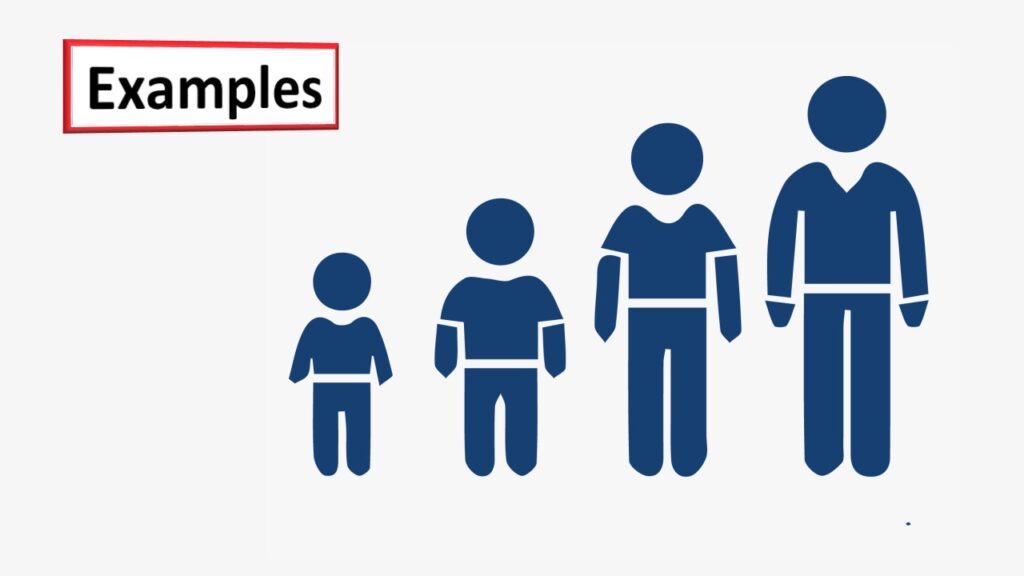
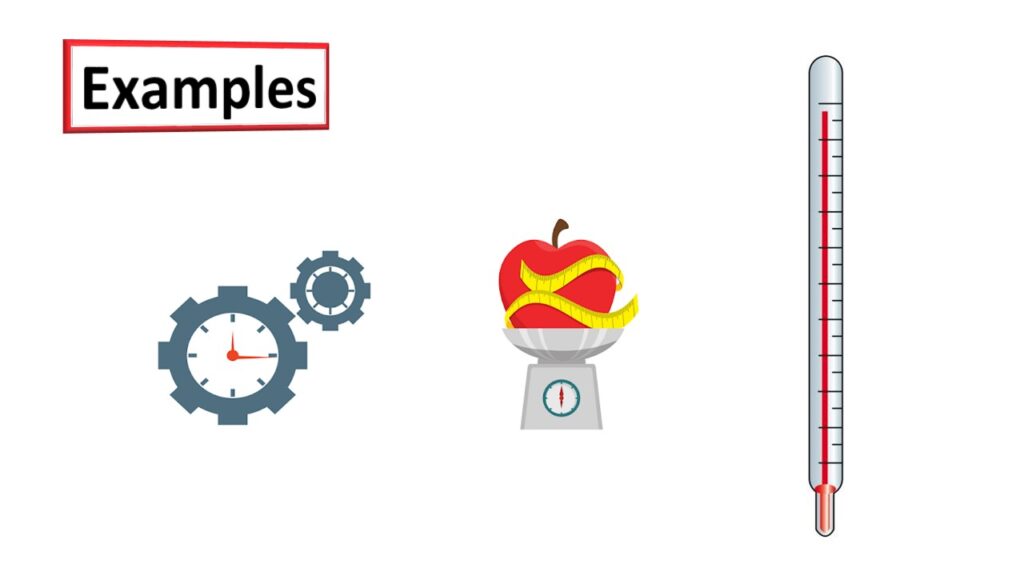
Example
Examples of scale data are
- Age
- Height
- Income
- Time
- Weight
- Temperature
Age
Income

Weight / Temperature
Now consider the following question.
| What is your income? |
| less than 50000 |
| 60000 |
| 70000 |
| more than 70000 |

The data that you get is numeric so this question falls into category of scale.
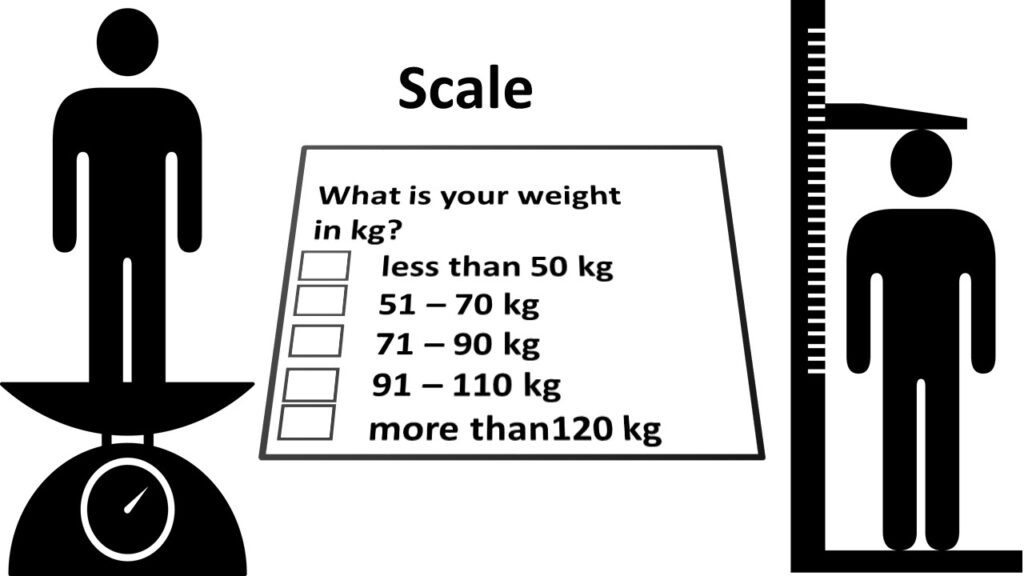
| What is your weight? | |
| less than 50 kg | |
| 51 – 70 kg | |
| 71 – 90 kg | |
| 91 – 110 kg | |
| more than 120 kg |
What is your weight in kilograms?
In this question also the data that you get is numeric so this question falls into category of scale.
Interval
An interval level of measurement is a way to measure data using numbers that represent equal intervals on a scale. This means that the numbers can be used to indicate the order of magnitude, but they cannot be used to determine the exact amount.
The main advantage of using an interval level of measurement is that it allows for more precise comparisons than other types of measurements. For instance, if you were measuring the height of two people, you could use an interval level of measurement to say that one person is exactly twice as tall as the other.
Ratio
A ratio is a level of measurement that is used to describe the relationship between two or more things. It is often used to compare quantities, such as size, speed, weight, or height. Ratios can be written as fractions or decimals.
With ratio level measurements, you can always be confident that your units are accurate and consistent. That’s why ratio level measurements are important in fields like science and engineering.
If you need to make precise measurements, then ratio level is the way to go. It’s the most exact and reliable level of measurement available. So if accuracy is key, make sure you’re using a ratio scale.
A ratio scale is used to calculate the following.
- market share
- annual sales
- the price of an upcoming product
- number of consumers
Example
In the Kelvin temperature scale, for example, there are no negative degrees of temperature – 0 indicates an absolute lack of thermal energy.
Nominal, Ordinal, Interval, and Ratio
| Data Type | Named Variables | Ordered Variables | Mathematical operations | Difference between variables | Absolute zero |
|---|---|---|---|---|---|
| Nominal | ✔ | ❌ | ❌ | ❌ | ❌ |
| Ordinal | ✔ | ✔ | ❌ | ❌ | ❌ |
| Interval | ✔ | ✔ | ✔ | ✔ | ❌ |
| Ratio | ✔ | ✔ | ✔ | ✔ | ✔ |
- Nominal scale is a naming scale.
- Ordinal scale has all its variables in a specific order, beyond just naming them.
- Interval offers labels, order, as well as, a specific interval between each of its variable options.
- Ratio can also accommodate the value of “zero” on any of its variables.
Why is Measurement of Scale Important?
In social science research, the Measurement of Scale is important because it determines the type of data that can be collected and the statistical methods that can be used to analyze that data.
Other articles
Please read through some of our other articles with examples and explanations if you’d like to learn more about research methodology.
Statistics
- PLS-SEM model
- Principal Components Analysis
- Multivariate Analysis
- Friedman Test
- Chi-Square Test (Χ²)
- T-test
- SPSS
- Effect Size
- Critical Values in Statistics
- Statistical Analysis
- Calculate the Sample Size for Randomized Controlled Trials
- Covariate in Statistics
- Avoid Common Mistakes in Statistics
- Standard Deviation
- Derivatives & Formulas
- Build a PLS-SEM model using AMOS
- Principal Components Analysis using SPSS
- Statistical Tools
- Type I vs Type II error
- Descriptive and Inferential Statistics
- Microsoft Excel and SPSS
- One-tailed and Two-tailed Test
- Parametric and Non-Parametric Test
Methodology
- Research Methodology Quiz MCQ
- Research Methods
- Quantitative Research
- Qualitative Research
- Case Study Research
- Survey Research
- Conclusive Research
- Descriptive Research
- Cross-Sectional Research
- Theoretical Framework
- Conceptual Framework
- Triangulation
- Grounded Theory
- Quasi-Experimental Design
- Mixed Method
- Correlational Research
- Randomized Controlled Trial
- Stratified Sampling
- Ethnography
- Ghost Authorship
- Secondary Data Collection
- Primary Data Collection
- Ex-Post-Facto
Research
- Table of Contents
- Dissertation Topic
- Synopsis
- Thesis Statement
- Research Proposal
- Research Questions
- Research Problem
- Research Gap
- Types of Research Gaps
- Variables
- Operationalization of Variables
- Literature Review
- Research Hypothesis
- Questionnaire
- Abstract
- Validity
- Reliability
- Measurement of Scale
- Sampling Techniques
- Acknowledgements