

In today’s data-driven world, individuals and organizations face the challenge of dealing with vast amounts of data for decision-making. The PLS-SEM model provides a powerful tool to uncover new insights in complex datasets.
What sets this model apart from other structural equation modeling (SEM) approaches, such as Confirmatory Factor Analysis (CFA) and path analysis, is its ability to establish linkages not only between latent and observed variables but also between multiple latent variables.
A statistical multivariate analysis technique called partial least square structural equation modelling (PLS-SEM) combines methods for analysing linear relationship and regression analysis methodologies.
In this article, we present an example that demonstrates how to use the PLS-SEM model to examine an indirect linear relationship between variables of sustainability.
PLS-SEM to examine the relationship between variables
In recent times, businesses have increasingly focused on the concept of sustainability to foster economic development.
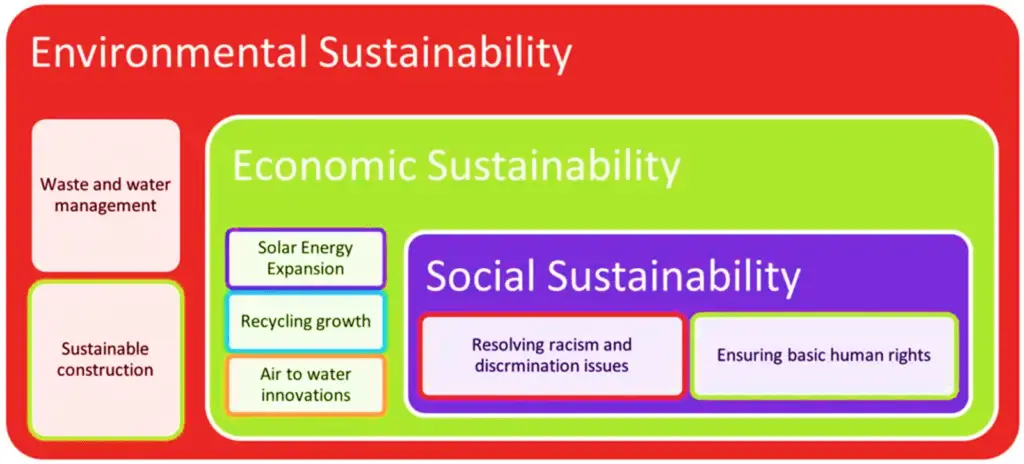
Sustainability encompasses three primary dimensions: economic sustainability, social sustainability, and environmental sustainability (Gelashvili et al., 2021).
These dimensions are interconnected, and as such, there exists a relationship between environmental, social, and economic sustainability. All these three are interdependent independent variables.
To investigate this relationship, we conducted a study involving 350 participants to gather their perceptions on sustainability and its various dimensions, which are as follows:
- Economic Sustainability
- Social Sustainability
- Environmental Sustainability
Path building using PLS-SEM for assessing the impact
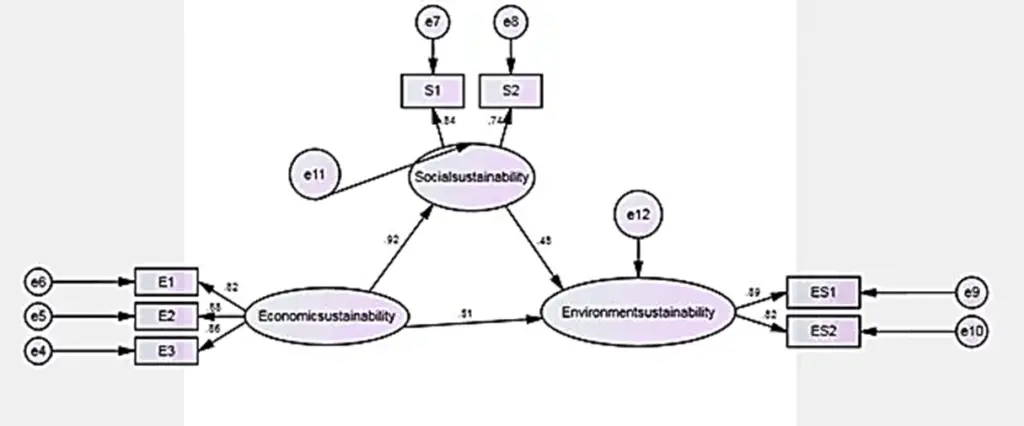
In this example, we used the Partial Least Square Structural Equation Modeling (PLS-SEM) approach to examine the impact of sustainability dimensions. The PLS-SEM model was chosen due to its capability to analyze both direct and indirect relationships between the three dimensions of sustainability. Each sustainability dimension is represented by specific components, with the coding as follows:
- Economic sustainability factors: E1 to E3
- Social sustainability factors: S1 to S2
- Environmental sustainability factors: ES1 to ES2
To establish linkages and relationships, we computed each sustainability type (latent variable) with its corresponding components (observed variables). In our analysis, the mediating role of social sustainability was taken into account, as it serves as a mediator between the other sustainability dimensions.
The graphical representation of this relationship is illustrated below:
Following the analysis, the first crucial step is to assess the efficiency of the obtained results. To achieve this, we conduct the reliability and validity tests.
Reliability and validity in PLS-SEM
Reliability and validity are vital aspects in Partial Least Square Structural Equation Modeling (PLS-SEM) that allow us to evaluate the suitability of variables in measuring the impact under consideration.
By conducting the necessary tests using SPSS Amos, we obtain the following results for composite reliability, internal consistency, convergent validity, and discriminant validity, presented in the table below:
| Construct | CR | AVE | Cronbach alpha | Sq (AVE) |
|---|---|---|---|---|
| Economic Sustainability | 0.89 | 0.88 | 0.88 | 0.94 |
| Social Sustainability | 0.79 | 0.78 | 0.76 | 0.88 |
| Environmental Sustainability | 0.87 | 0.89 | 0.85 | 0.94 |
Internal Consistency
Internal consistency is a reliability measure that assesses the linkage between constructs to assess the effectiveness of their components in measuring each variable. The Cronbach’s alpha test is employed for this purpose.
In our analysis, the Cronbach alpha values for economic sustainability, social sustainability, and environmental sustainability are 0.88, 0.76, and 0.85, respectively. Since all these values exceed the required threshold of 0.7, the model demonstrates internal consistency.
Convergent Validity
Convergent validity determines the presence of a close relationship between a variable and other variables or statements measuring the construct. It is evaluated using the Average Variance Extracted (AVE).
In our study, the AVE values for economic sustainability, social sustainability, and environmental sustainability are 0.88, 0.78, and 0.89, respectively, all of which exceed the acceptable threshold of 0.5. Therefore, the model exhibits convergent validity.
Composite Reliability
Composite reliability is another reliability measure used to assess the significance of incorporating a particular construct into the model.
The composite reliability values for economic sustainability, social sustainability, and environmental sustainability are 0.89, 0.79, and 0.87, respectively, surpassing the required threshold of 0.7. Hence, the model demonstrates composite reliability.
Discriminant Validity
Discriminant validity is a method that emphasizes the differentiation of each construct from other constructs used in the model. In our analysis, the Average Variance Extracted (AVE) values for economic sustainability, environmental sustainability, and social sustainability are 0.94, 0.94, and 0.88, respectively.
These values are greater than the corresponding correlation values between constructs, such as 0.80 for environment and economic sustainability, 0.69 for social and economic sustainability, and 0.70 for environmental and social sustainability. Thus, the model exhibits discriminant validity, indicating that each construct is distinct from the others.
| Economic Sustainability | Environmental Sustainability | Social Sustainability | |
| Economic Sustainability | 0.94 | ||
|---|---|---|---|
| Environmental Sustainability | 0.80 | 0.94 | |
| Social Sustainability | 0.69 | 0.70 | 0.88 |
Having met all the criteria for reliability and validity, the model is deemed reliable and valid. With confidence in the accuracy of the variables and their measurements, we can proceed to the next step, which involves examining the model’s fitness.
Model Fitness
Model fitness is a crucial assessment method used to evaluate the efficiency and linkage between variables in the model. The results are presented in the table below:
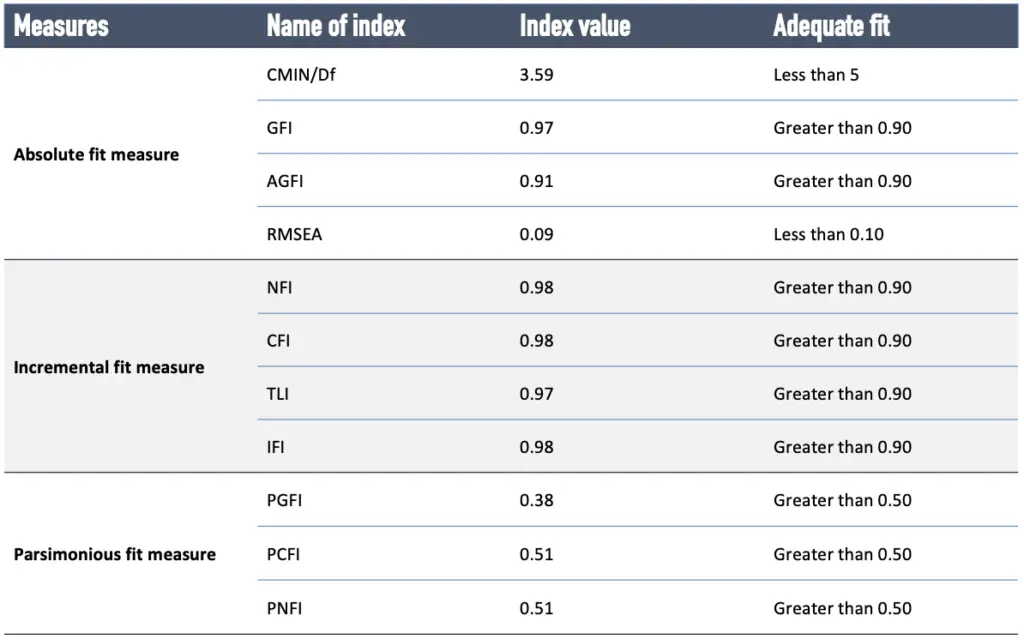
Absolute Fitness: The table reveals that the value of CMIN/Df is 3.59 (less than 5), GFI is 0.971 (greater than 0.90), AGFI is 0.91 (greater than 0.90), and RMSEA is 0.09 (less than 0.10). As all the required values for absolute fitness are met, the model is considered to be absolutely fit.
Incremental Fitness: For incremental fitness measurement, the values of NFI (0.98), CFI (0.98), TLI (0.97), and IFI (0.98) all exceed the threshold of 0.9. This indicates the presence of incremental fitness in the model, as all the measures meet the required criteria.
Parsimonious Fitness: For parsimonious fitness, the values of PGFI (0.38), PCFI (0.51), and PNFI (0.51) are within the acceptable range. With the majority of measures falling within the adequate fitness criteria, the model demonstrates parsimonious fitness.
As a result, because the model meets the criteria for the majority of fitness indices, it is absolutely, incrementally, and parsimoniously fit and might be utilised for impact assessment.
Impact analysis
The Impact analysis using the PLS-SEM model reveals the interrelationships between variables through assessments of reliability, validity, and model fitness. In this specific case, our focus is on testing the impact of economic or social sustainability on environmental or social sustainability. The formulated hypotheses are as follows:
H01: There is no significant impact between the different dimensions of sustainability in the model.
HA1: There is a significant impact between the different dimensions of sustainability in the model.
To determine the significance, the level was set at 5%. The results of the analysis are presented below.
| Dependent variable | Independent variable | Estimate | S.E. | C.R. | P |
|---|---|---|---|---|---|
| Social Sustainability | Economic sustainability | 0.84 | 0.05 | 16.00 | 0.00 |
| Environmental Sustainability | Social Sustainability | 0.52 | 0.20 | 2.57 | 0.01 |
| Environment Sustainability | Economic Sustainability | 0.50 | 0.18 | 2.81 | 0.01 |
In the table provided above, the standard error values of the variables slightly exceed 0.1. However, the values remain approximately close to 0, indicating that there are minimal biases present in the model. The p-values for each variable are all less than 0.05, specifically 0.00, 0.01, and 0.01. Additionally, the CR values are 16, 2.58, and 2.81, all of which are greater than 1.96 (the Z-value at 5% significance level). As a result, the null hypothesis (H0) is rejected.
Having tested the hypothesis, we now proceed to assess the impact. From the data, we draw the following observations:
- Relationship between economic and social sustainability: A 1% increase in economic sustainability leads to an 0.84% improvement in social sustainability.
- Relationship between social and environmental sustainability: A 1% rise in social sustainability brings about a 0.52% change in environmental sustainability.
- Relationship between economic and environmental sustainability: A 1% increase in economic sustainability results in a 0.50% improvement in environmental sustainability.
The dimensions of sustainability are found to have positive contributions, but the impact assessment reveals that economic sustainability has a greater influence on social sustainability compared to environmental sustainability.
Testing the impact of a mediating variable
After establishing the impact between the variables, we proceed to examine the indirect effect using social sustainability as a mediating variable. The function of each variable and the test results are displayed in the table.
| Dependent variable | Independent variable | Mediating variable | Direct effect | Indirect effect |
|---|---|---|---|---|
| Environmental Sustainability | Economic Sustainability | Social Sustainability | 0.50** | 0.44** |
From the table, it is evident that economic sustainability has a direct and significant impact on environmental sustainability. Additionally, economic sustainability also influences environmental sustainability indirectly through social sustainability, and both indirect effects are positive and significant. However, the value of the direct effect (0.50) is greater than the value of the indirect effect (0.44).
This indicates that while social sustainability partially contributes as a mediating factor between economic and environmental sustainability, the direct influence of economic sustainability is more pronounced on environmental sustainability.
Why to use PLS-SEM method?
The PLS-SEM method is chosen for this analysis due to its effectiveness in assessing complex relationships between variables.
In this case, PLS-SEM was well-suited for examining the indirect effects and understanding relationships even between latent variables. The analysis revealed that economic sustainability has both a direct and indirect impact on environmental sustainability (mediated through social sustainability), but the direct influence holds greater significance.
Alternatively, path analysis could have been applied if there was only one mediating factor involved. However, in situations where multiple mediating or moderating variables are present, PLS-SEM proves to be a more appropriate and effective approach.
References
- Gelashvili, V., Martínez-Navalón, J.-G., & Saura, J. R. (2021). Using Partial Least Squares Structural Equation Modeling to Measure the Moderating Effect of Gender : An Empirical Study. Mathematics.
Other articles
Please read through some of our other articles with examples and explanations if you’d like to learn more.
Statistics
- PLS-SEM model
- Principal Components Analysis
- Multivariate Analysis
- Friedman Test
- Chi-Square Test (Χ²)
- T-test
- SPSS
- Effect Size
- Critical Values in Statistics
- Statistical Analysis
- Calculate the Sample Size for Randomized Controlled Trials
- Covariate in Statistics
- Avoid Common Mistakes in Statistics
- Standard Deviation
- Derivatives & Formulas
- Build a PLS-SEM model using AMOS
- Principal Components Analysis using SPSS
- Statistical Tools
- Type I vs Type II error
- Descriptive and Inferential Statistics
- Microsoft Excel and SPSS
- One-tailed and Two-tailed Test
- Parametric and Non-Parametric Test
Citation Styles
Comparision
- Independent vs. Dependent Variable – MIM Learnovate
- Research Article and Research Paper
- Proposition and Hypothesis
- Principal Component Analysis and Partial Least Squares
- Academic Research vs Industry Research
- Clinical Research vs Lab Research
- Research Lab and Hospital Lab
- Thesis Statement and Research Question
- Quantitative Researchers vs. Quantitative Traders
- Premise, Hypothesis and Supposition
- Survey Vs Experiment
- Hypothesis and Theory
- Independent vs. Dependent Variable
- APA vs. MLA
- Ghost Authorship vs. Gift Authorship
- Basic and Applied Research
- Cross-Sectional vs Longitudinal Studies
- Survey vs Questionnaire
- Open Ended vs Closed Ended Questions
- Experimental and Non-Experimental Research
- Inductive vs Deductive Approach
- Null and Alternative Hypothesis
- Reliability vs Validity
- Population vs Sample
- Conceptual Framework and Theoretical Framework
- Bibliography and Reference
- Stratified vs Cluster Sampling
- Sampling Error vs Sampling Bias
- Internal Validity vs External Validity
- Full-Scale, Laboratory-Scale and Pilot-Scale Studies
- Plagiarism and Paraphrasing
- Research Methodology Vs. Research Method
- Mediator and Moderator
- Type I vs Type II error
- Descriptive and Inferential Statistics
- Microsoft Excel and SPSS
- Parametric and Non-Parametric Test
Research
- Table of Contents
- Dissertation Topic
- Synopsis
- Thesis Statement
- Research Proposal
- Research Questions
- Research Problem
- Research Gap
- Types of Research Gaps
- Variables
- Operationalization of Variables
- Literature Review
- Research Hypothesis
- Questionnaire
- Abstract
- Validity
- Reliability
- Measurement of Scale
- Sampling Techniques
- Acknowledgements
- Research Methods
- Quantitative Research
- Qualitative Research
- Case Study Research
- Survey Research
- Conclusive Research
- Descriptive Research
- Cross-Sectional Research
- Theoretical Framework
- Conceptual Framework
- Triangulation
- Grounded Theory
- Quasi-Experimental Design
- Mixed Method
- Correlational Research
- Randomized Controlled Trial
- Stratified Sampling
- Ethnography
- Ghost Authorship
- Secondary Data Collection
- Primary Data Collection
- Ex-Post-Facto