
Principal Component Analysis (PCA)
The multi-collinearity problem can be resolved, and the number of predictive variables reduced using a traditional multivariate statistical method known as PCA. With little information loss, principal component analysis looks for a small number of linear combinations of the variables that can be used to summarize the data.
In PCA, the variance-covariance structure of a data collection is attempted to be explained. In order to drastically reduce information loss, the goal is to enhance the variance of the characteristics themselves. PCA is a Dimensionality Reduction algorithm.
Read more: T-test | Example, Formula | When to Use a T-test
Principal components are pairwise orthogonal. Principal components are focus on maximize correlation.
Partial Least Squares (PLS)
In fields like chemical engineering, where predictive variables frequently consist of different measurements made during an experiment and the relationships between these variables are little understood, partial least squares have become increasingly popular.
These measurements often are related to a few underlying latent factors that remain unobserved.
Partial Least Squares, use the annotated label to maximize inter-class variance.
Read More: Chi-Square Test (Χ²) || Examples, Types, and Assumptions
Similarities between PCA and PLS
PCA and PLS are both employed for dimension reduction.
Read More: Reliability vs Validity | Examples
PCA and PLS in regression analysis
There are two uses for PCA and PLS in regression analysis.
- First, both methods apply linear transformations to convert a set of highly correlated variables into a set of independent variables.
- Second, variable reductions are accomplished using both methods.
The supervised nature of the PLS method makes it more effective than the PCA algorithm for dimension reduction when a dependent variable for a regression is specified.
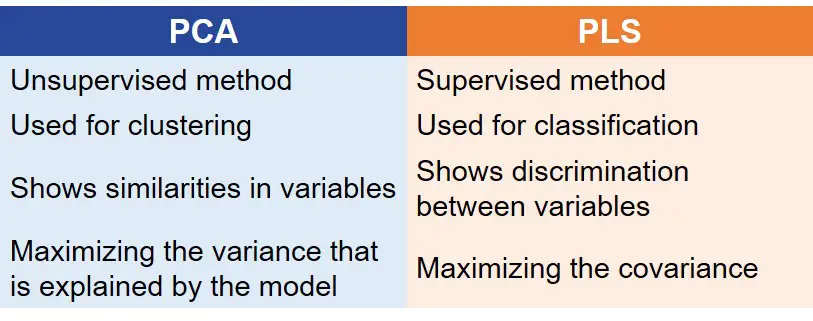
PCA vs PLS
| PCA | PLS |
| Unsupervised method | Supervised method |
| Used for clustering | Used for classification |
| Shows similarities in variables | Shows discrimination between variables |
| Maximizing the variance that is explained by the model | Maximising the covariance. |
Difference Between Principal Component Analysis and Partial Least Squares
- PLS is a supervised method where you provide the data on the group of each sample. Contrarily, PCA is an unsupervised method, which means you simply project the data to, let’s say, 2D space in a useful way to observe how the samples are clustering on their own.
- If you know the groups of each sample and want to predict the groups of future samples, PLS is used.
- PCA is used for clustering whereas PLS is used for classification.
- PCA shows the similarities in variables, but PLS shows the discrimination between variables.
- Mathematically, In PLS, we are maximizing the covariance whereas, In PCA, we are maximizing the variance that is explained by the model.
Other articles
Please read through some of our other articles with examples and explanations if you’d like to learn more about research methodology.
Comparision
- Basic and Applied Research
- Cross-Sectional vs Longitudinal Studies
- Survey vs Questionnaire
- Open Ended vs Closed Ended Questions
- Experimental and Non-Experimental Research
- Inductive vs Deductive Approach
- Null and Alternative Hypothesis
- Reliability vs Validity
- Population vs Sample
- Conceptual Framework and Theoretical Framework
- Bibliography and Reference
- Stratified vs Cluster Sampling
- Sampling Error vs Sampling Bias
- Internal Validity vs External Validity
- Full-Scale, Laboratory-Scale and Pilot-Scale Studies
- Plagiarism and Paraphrasing
- Research Methodology Vs. Research Method
- Mediator and Moderator
- Type I vs Type II error
- Descriptive and Inferential Statistics
- Microsoft Excel and SPSS
- Parametric and Non-Parametric Test
Comparision
- Independent vs. Dependent Variable
- Research Article and Research Paper
- Proposition and Hypothesis
- Principal Component Analysis and Partial Least Squares
- Academic Research vs Industry Research
- Clinical Research vs Lab Research
- Research Lab and Hospital Lab
- Thesis Statement and Research Question
- Quantitative Researchers vs. Quantitative Traders
- Premise, Hypothesis and Supposition
- Survey Vs Experiment
- Hypothesis and Theory
- Independent vs. Dependent Variable
- APA vs. MLA
- Ghost Authorship vs. Gift Authorship
Research
- Research Methods
- Quantitative Research
- Qualitative Research
- Case Study Research
- Survey Research
- Conclusive Research
- Descriptive Research
- Cross-Sectional Research
- Theoretical Framework
- Conceptual Framework
- Triangulation
- Grounded Theory
- Quasi-Experimental Design
- Mixed Method
- Correlational Research
- Randomized Controlled Trial
- Stratified Sampling
- Ethnography
- Ghost Authorship
- Secondary Data Collection
- Primary Data Collection
- Ex-Post-Facto
Research
- Table of Contents
- Dissertation Topic
- Synopsis
- Thesis Statement
- Research Proposal
- Research Questions
- Research Problem
- Research Gap
- Types of Research Gaps
- Variables
- Operationalization of Variables
- Literature Review
- Research Hypothesis
- Questionnaire
- Abstract
- Validity
- Reliability
- Measurement of Scale
- Sampling Techniques
- Acknowledgements
Statistics