

In the field of statistics, researchers often encounter situations where they need to compare multiple related groups or conditions. The Friedman test is a non-parametric statistical test designed specifically for this purpose.
It allows researchers to determine if there are significant differences among multiple related groups.
In this blog post, we will delve into the definition, example, and assumptions of the Friedman test.
Friedman Test
The Friedman test is a non-parametric alternative to the repeated measures analysis of variance (ANOVA) test. It is used to analyze data where the same subjects are measured under different conditions or at different time points.
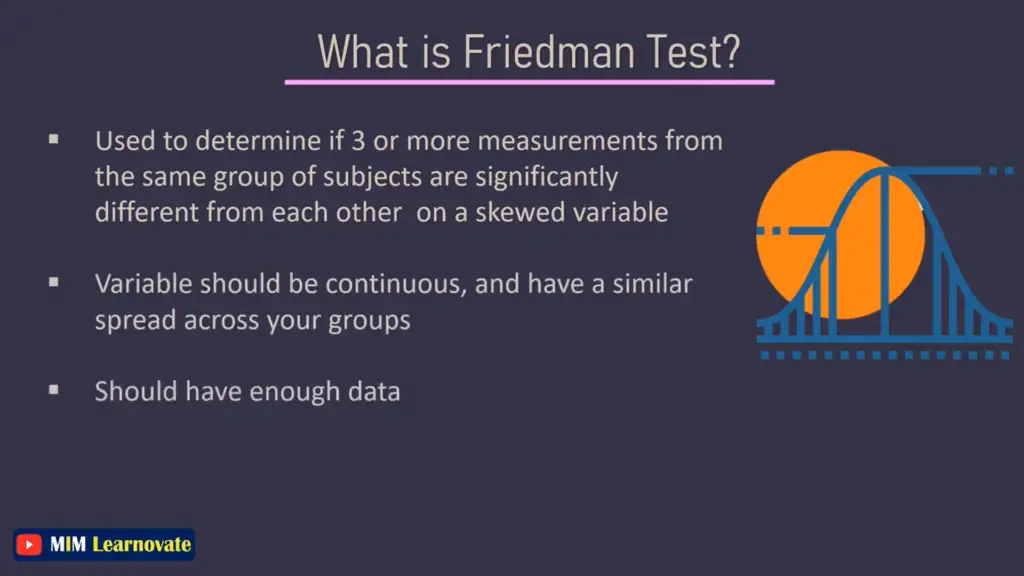
The test determines whether there are any significant differences in the rankings or ordinal data across the multiple related groups.
Example of Friedman Test
To better understand the Friedman test, let’s consider an example. Suppose a group of 20 individuals participates in a study that aims to compare the effectiveness of three different pain relief methods: medication A, medication B, and a placebo.
Each participant tries all three methods, and their pain relief levels are rated on a scale of 1 to 10 for each method.
Assumptions of the Friedman Test
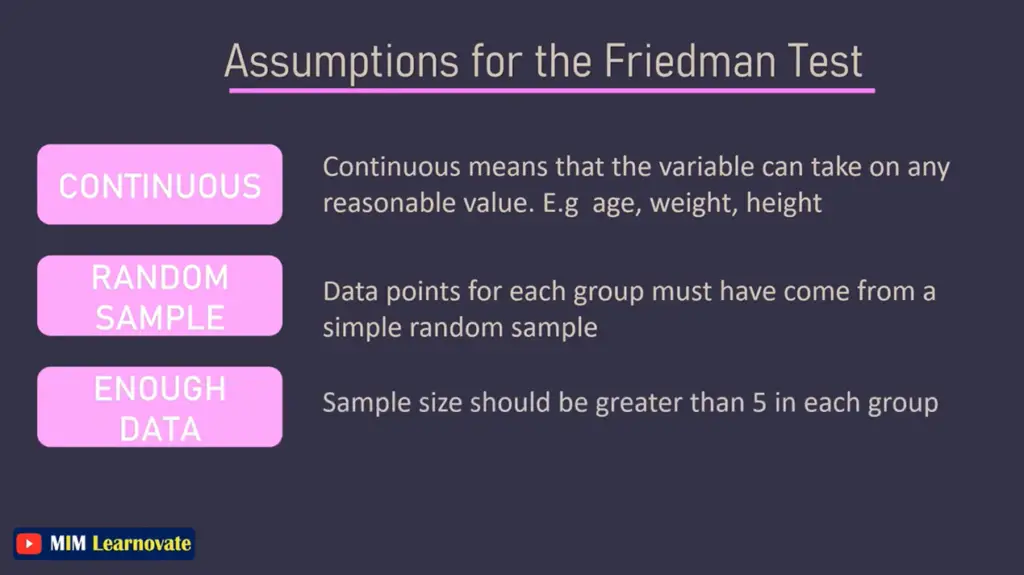
Before conducting the Friedman test, it is important to ensure that certain assumptions are met. Here are the key assumptions for applying the Friedman test effectively:
- Dependent Variable: The dependent variable should be measured on an ordinal or rank scale. The data must represent rankings or orderings rather than absolute values.
- Independence: The observations within each group or condition should be independent of each other. In our example, each participant’s pain relief ratings for different methods should be independent.
- Related Groups: The groups or conditions being compared should be related. This means that the same subjects are measured under each group or condition. In our example, the 20 individuals try all three pain relief methods.
- Random Sampling or Assignment: The subjects should be randomly selected or assigned to the different groups or conditions to ensure unbiased results.
- Homogeneity of Variances: The variances of the ranked data should be similar across the groups or conditions being compared. This assumption can be checked using statistical tests like the Cochran’s Q test.
Interpreting the Friedman Test
The Friedman test produces a test statistic, denoted as χ^2 (chi-square), which follows a chi-square distribution.
The test compares the ranked data across the different groups and assesses whether there are significant differences.
If the calculated chi-square value exceeds the critical value from the chi-square distribution table or if the p-value is less than the predetermined significance level (e.g., 0.05), we reject the null hypothesis.
This indicates that there are significant differences among the groups.
In our example, if the Friedman test reveals a significant result, it suggests that at least one pain relief method is different from the others in terms of effectiveness. Post-hoc tests or pairwise comparisons can then be conducted to determine which specific pairs of methods are significantly different.
When to Use the Friedman Test?
The Friedman test is appropriate to use in situations where you have multiple related groups or conditions and want to determine if there are significant differences among them.
The Friedman Test is commonly used in two situations:
- Calculating the subjects’ mean scores over three or more times
For example, you could want to test individuals’ resting heart rates one month before they begin a training program, one month after they begin the program, and two months after they complete the program. The Friedman Test can be used to determine whether there is a substantial variation in the patients’ mean resting heart rates between these three time points.
- Calculating the subjects’ mean scores under three conditions
You may, for instance, ask participants to rate each of three films according to their level of enjoyment. You can use a Friedman Test to determine whether there is a significant difference in the mean ratings of the three films because each subject appears in each sample.
Applications of Friedman test
Here are some specific scenarios where the Friedman test is commonly applied:
- Experimental studies with repeated measures: If you are conducting a study where the same subjects are measured or tested under different conditions or time points, the Friedman test can be used to analyze the data. For example, a study comparing the effectiveness of different teaching methods across multiple sessions with the same group of students.
- Clinical trials and medical research: In clinical trials or medical research, the Friedman test can be used to assess the efficacy of different treatments or interventions on the same group of patients. For instance, evaluating the effects of various dosages of a medication on pain relief in a group of patients over time.
- Preference or ranking studies: When participants are asked to rank or rate multiple options or alternatives, the Friedman test can be used to determine if there are significant differences in the rankings. For example, comparing the preferences for different brands of a product among consumers.
- Psychological or social science research: In studies involving surveys or questionnaires with Likert scale ratings or ordinal responses, the Friedman test can be used to examine differences across multiple groups or conditions. This includes areas such as attitude research, personality assessment, or satisfaction surveys.
- Environmental or ecological studies: In ecological research, the Friedman test can be used to analyze data collected from different sites or time periods to determine if there are significant differences in ecological variables, such as species diversity or abundance.
It is important to note that the Friedman test is a non-parametric test, which means it does not make assumptions about the underlying distribution of the data. It is particularly useful when the data are measured on an ordinal or rank scale and do not meet the assumptions of parametric tests such as normality or homogeneity of variances.
By considering the nature of your data and the research design, you can determine if the Friedman test is appropriate for your analysis and utilize it to gain insights into the differences among multiple related groups or conditions.
Conclusion
The Friedman test is a valuable statistical tool when comparing multiple related groups or conditions measured on an ordinal or rank scale.
By understanding its definition, assumptions, and interpretation, researchers can confidently analyze data in situations where traditional parametric tests are not appropriate.
Remember, the Friedman test provides a non-parametric alternative to explore differences in ranked data.
By applying this test correctly and considering its assumptions, researchers can gain valuable insights into the relationships among multiple related groups, contributing to robust statistical analysis and meaningful research findings.
Other articles
Please read through some of our other articles with examples and explanations if you’d like to learn more.
Statistics
- PLS-SEM model
- Principal Components Analysis
- Multivariate Analysis
- Friedman Test
- Chi-Square Test (Χ²)
- T-test
- SPSS
- Effect Size
- Critical Values in Statistics
- Statistical Analysis
- Calculate the Sample Size for Randomized Controlled Trials
- Covariate in Statistics
- Avoid Common Mistakes in Statistics
- Standard Deviation
- Derivatives & Formulas
- Build a PLS-SEM model using AMOS
- Principal Components Analysis using SPSS
- Statistical Tools
- Type I vs Type II error
- Descriptive and Inferential Statistics
- Microsoft Excel and SPSS
- One-tailed and Two-tailed Test
- Parametric and Non-Parametric Test
Citation Styles
Comparision
- Independent vs. Dependent Variable – MIM Learnovate
- Research Article and Research Paper
- Proposition and Hypothesis
- Principal Component Analysis and Partial Least Squares
- Academic Research vs Industry Research
- Clinical Research vs Lab Research
- Research Lab and Hospital Lab
- Thesis Statement and Research Question
- Quantitative Researchers vs. Quantitative Traders
- Premise, Hypothesis and Supposition
- Survey Vs Experiment
- Hypothesis and Theory
- Independent vs. Dependent Variable
- APA vs. MLA
- Ghost Authorship vs. Gift Authorship
- Basic and Applied Research
- Cross-Sectional vs Longitudinal Studies
- Survey vs Questionnaire
- Open Ended vs Closed Ended Questions
- Experimental and Non-Experimental Research
- Inductive vs Deductive Approach
- Null and Alternative Hypothesis
- Reliability vs Validity
- Population vs Sample
- Conceptual Framework and Theoretical Framework
- Bibliography and Reference
- Stratified vs Cluster Sampling
- Sampling Error vs Sampling Bias
- Internal Validity vs External Validity
- Full-Scale, Laboratory-Scale and Pilot-Scale Studies
- Plagiarism and Paraphrasing
- Research Methodology Vs. Research Method
- Mediator and Moderator
- Type I vs Type II error
- Descriptive and Inferential Statistics
- Microsoft Excel and SPSS
- Parametric and Non-Parametric Test
Research
- Table of Contents
- Dissertation Topic
- Synopsis
- Thesis Statement
- Research Proposal
- Research Questions
- Research Problem
- Research Gap
- Types of Research Gaps
- Variables
- Operationalization of Variables
- Literature Review
- Research Hypothesis
- Questionnaire
- Abstract
- Validity
- Reliability
- Measurement of Scale
- Sampling Techniques
- Acknowledgements
- Research Methods
- Quantitative Research
- Qualitative Research
- Case Study Research
- Survey Research
- Conclusive Research
- Descriptive Research
- Cross-Sectional Research
- Theoretical Framework
- Conceptual Framework
- Triangulation
- Grounded Theory
- Quasi-Experimental Design
- Mixed Method
- Correlational Research
- Randomized Controlled Trial
- Stratified Sampling
- Ethnography
- Ghost Authorship
- Secondary Data Collection
- Primary Data Collection
- Ex-Post-Facto