In the field of statistics, the chi-square test is a powerful tool used to analyze categorical data and determine if there is a significant association or difference between observed and expected frequencies.
It allows researchers to investigate relationships and patterns within categorical variables.
In this blog post, we will explore the definition, examples, types, and assumptions of the chi-square test, providing a comprehensive understanding of its application.
What is a Chi-Square Test?
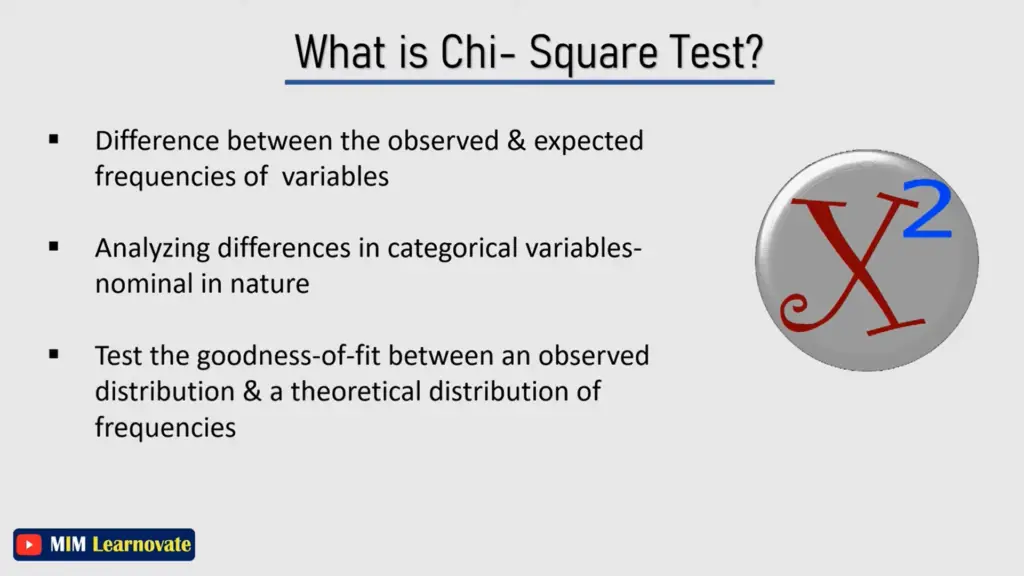
Pearson’s chi-square (X2) tests, also known as chi-square tests, are among the most frequent nonparametric tests.
A chi-square test is a statistical test that assesses the independence or goodness-of-fit of categorical variables based on observed and expected frequencies.
Use a chi-square test or equivalent nonparametric test if you want to test a hypothesis regarding the distribution of a categorical variable. Categorical variables, which indicate groupings like animals or countries, can be nominal or ordinal. They cannot have a normal distribution since they can only have a few limited values.
Notably, while categorical variables can be used as independent variables in parametric tests (such as ANOVAs), they cannot be used to test hypotheses concerning the distribution of categorical variables.
For categorical data, a statistical test called the Pearson’s chi-square test is used. It is used to determine whether your data is considerably different from what you expected.
The test calculates a chi-square statistic and determines the probability of obtaining such results by chance.
Chi-square is frequently represented by the symbol X2, and its name is pronounced “kai-square” (rhymes with “eye-square”). Additionally known as chi-squared.
Read More: T-test | Example, Formula | When to Use a T-test
Example of Chi-Square Test
To better grasp the concept, consider an example where we want to examine whether there is a relationship between gender and voting preference (two categorical variables) in a sample of 200 individuals. We collect data and observe the following frequencies:
         Male    Female
A          40        30
B          50        20
C          30        30
To test the independence between gender and voting preference, we will conduct a chi-square test.
what is Chi-square test used for?
The chi-square test is a statistical test used to determine whether there is a significant association or relationship between two categorical variables. It allows you to assess whether the observed frequencies of different categories in the variables deviate significantly from the expected frequencies, assuming independence between the variables.
The chi-square test is commonly used in various fields to analyze categorical data and investigate relationships or associations. Some common applications of the chi-square test include:
- Goodness-of-fit test: It is used to compare observed frequencies in a single categorical variable to the expected frequencies derived from a theoretical distribution or hypothesis. This can help determine if the observed data fits a specific distribution or hypothesis.
- Independence test: It examines whether there is a relationship or association between two categorical variables. It is often used to assess if the variables are independent or if they have a significant association.
- Homogeneity test: It is employed to compare the distributions of a categorical variable across different groups or populations. It helps determine if the distributions are similar or if there are significant differences between them.
- Test of association in contingency tables: It analyzes the relationship between two categorical variables when they are arranged in a contingency table. It can reveal whether the variables are dependent or independent of each other.
The chi-square test is widely utilized in various fields, including social sciences, market research, public health, biology, and genetics, among others. It provides valuable insights into the relationships between categorical variables and assists in understanding the patterns and trends within the data.
Types of Chi-Square Tests
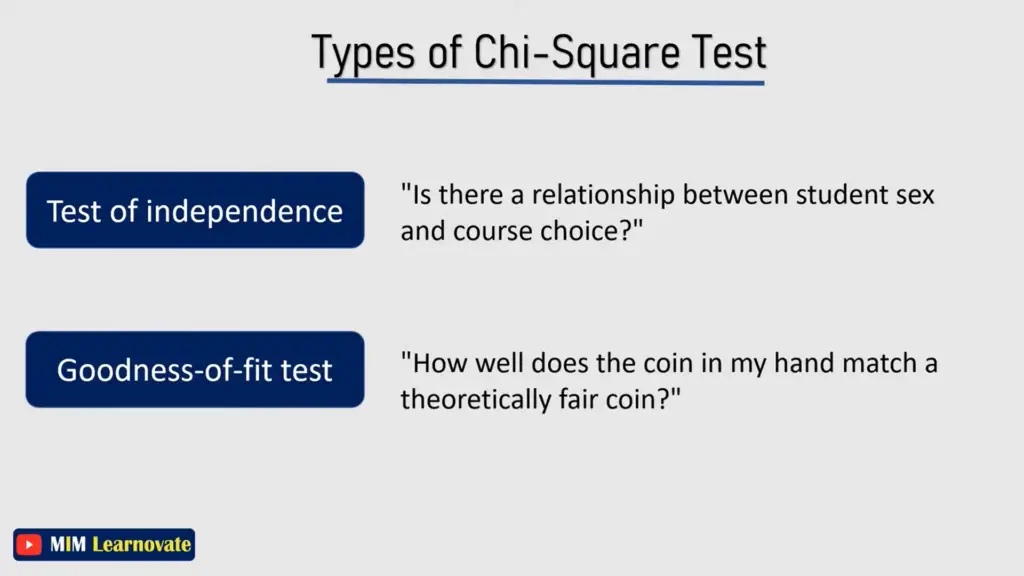
Chi-Square Test of Independence
This type of chi-square test determines whether there is a significant association between two categorical variables. It is used to investigate if there is a relationship between the variables.
Example: Chi-square test of independence
The null hypothesis (H0) states that the proportion of left-handed people in America and Canada is the same.
Alternative hypothesis (HA): The proportion of persons who are left-handed differs by nationality.
Chi-Square Test of Goodness-of-Fit
The chi-square test of goodness-of-fit examines whether the observed frequencies in one categorical variable differ significantly from the expected frequencies derived from a theoretical distribution or a specific hypothesis.
Example: Hypotheses for chi-square goodness of fit test
Expectation of equal proportions
Null hypothesis (H0): The proportion of each bird species using the feeder is equal (H0).
Alternative hypothesis (HA): various bird species visit the bird feeder in different proportions.
Expectation of different proportions
Null hypothesis (H0): Bird species visit the bird feeder in the same proportions as in the previous five years on average.
Alternative hypothesis (HA): Different bird species use the bird feeder in varying numbers, which is different from the average during the past five years.
Test hypotheses about frequency distributions
In hypothesis testing, specifically when analyzing frequency distributions, the chi-square test is a widely used statistical test. This test assesses whether the observed frequency distribution of a categorical variable significantly deviates from its expected frequency distribution.
It helps to determine if there is a relationship or association between variables based on the observed frequencies.
There are two types of Pearson’s chi-square tests commonly used in such scenarios:
- Chi-Square Goodness of Fit Test: The chi-square goodness of fit test compares the observed frequencies of a single categorical variable with the expected frequencies derived from a specific hypothesis or theoretical distribution. This test determines whether the observed data fits the expected distribution.
For example, let’s consider a scenario where we record the frequency of visits by different bird species at a bird feeder during a 24-hour period. The observed frequencies are as follows:
Bird species              Frequency
House sparrow             15
House finch               12
Black-capped chickadee     9
Common grackle             8
European starling          8
Mourning dove              6
We can use a chi-square goodness of fit test to determine if these observed frequencies significantly differ from what would be expected, such as equal frequencies.
- Chi-Square Test of Independence: The chi-square test of independence assesses whether there is a significant relationship between two categorical variables. It examines if the observed frequencies in a contingency table (a specific type of frequency distribution table) differ significantly from the frequencies expected if the variables were independent.
Continuing with our example, suppose we have a contingency table that displays the handedness of a sample of Americans and Canadians:
               Right-handed    Left-handed
American            236             19
Canadian            157             16
Using a chi-square test of independence, we can test if the observed frequencies of handedness are significantly different from the frequencies expected if handedness and nationality were unrelated.
These chi-square tests provide statistical evidence to support or reject hypotheses about frequency distributions and associations between categorical variables. By comparing observed and expected frequencies, researchers can gain insights into the relationships and patterns present in the data.
Assumptions of the Chi-Square Test
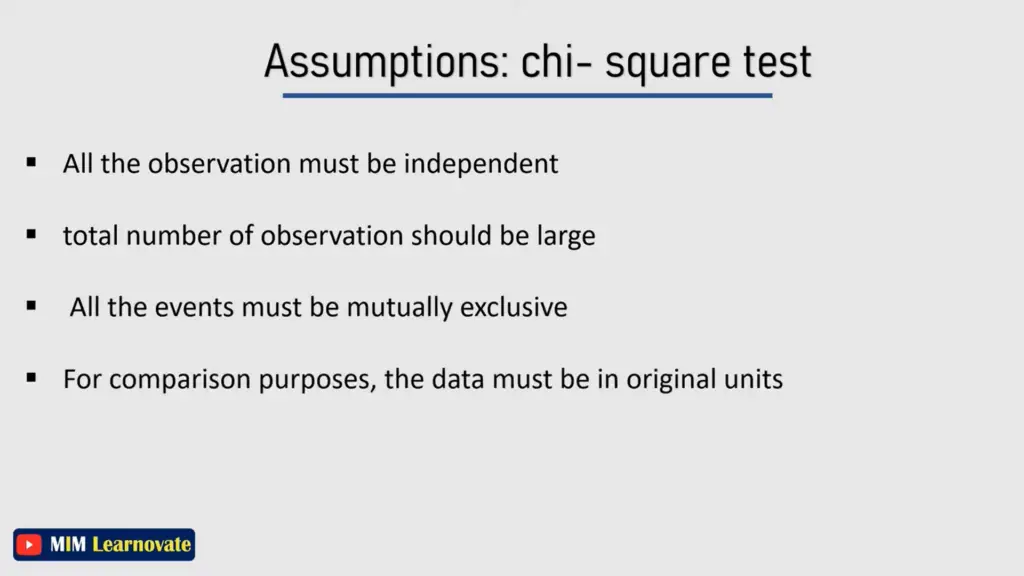
- Independence: The observations must be independent of each other. Each observation should belong to only one category and should not influence or be influenced by other observations.
- Sample Size: The sample size should be sufficiently large to ensure the validity of the chi-square test results. If the sample size is too small, the test may not provide accurate conclusions.
- Expected Frequencies: The expected frequencies in each category should be at least 5 or higher. When the expected frequencies are too small, the chi-square test may yield unreliable results.
The chi-square formula
Pearson’s chi-square tests both employ the same formula to get the test statistic, chi-square (X2):

Where:
- Σ is the summation operator (it means “take the sum of”)
- O is the observed frequency
- E is the expected frequency
- Χ2 is the chi-square test statistic
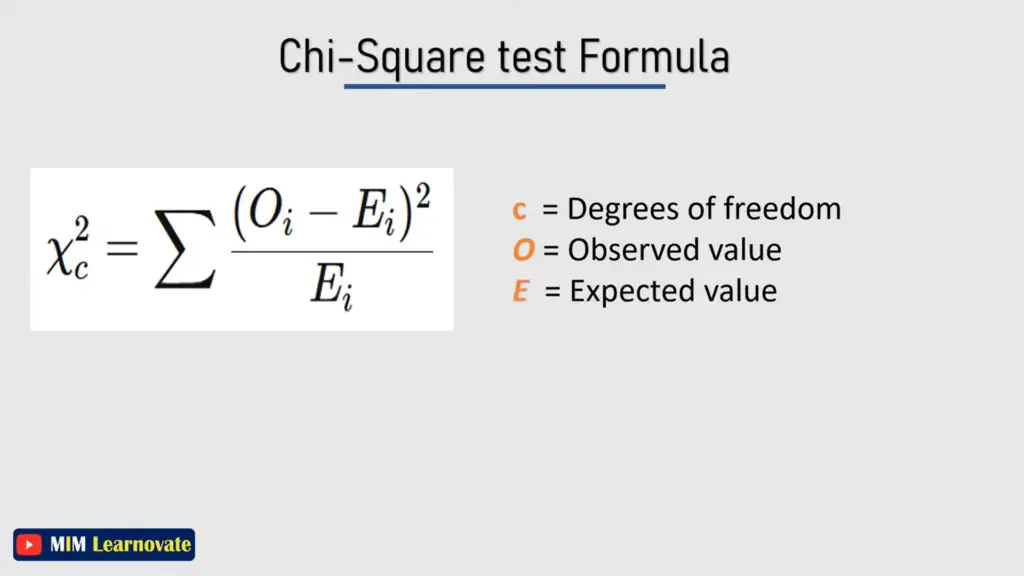
The chi-square will be larger the greater the difference between the observations and the expectations (O – E in the equation). You evaluate the chi-square value against a critical value to see whether the difference is large enough to be statistically significant.
When to use a chi-square test A Pearson’s chi-square test may be an appropriate option for your data if all of the following are true:
- You want to test a hypothesis about one or more categorical variables.
- If one or more of your variables is quantitative, you should use a different statistical test.
- Alternatively, you could convert the quantitative variable into a categorical variable by separating the observations into intervals.
- The sample was randomly selected from the population.
- There are a minimum of five observations expected in each group or combination of groups.
When to use a chi-square test?
- Testing Hypotheses about Categorical Variables: The chi-square test is commonly used when you want to examine the relationship between two categorical variables or test hypotheses about the distribution of a single categorical variable. It helps determine if the observed frequencies differ significantly from the expected frequencies.
- Random Sampling: It is important to ensure that your sample is randomly selected from the population. This helps in making accurate inferences and generalizations about the population based on the sample results.
- Adequate Sample Size: The chi-square test assumes that each category or group has a minimum expected frequency of five. This guideline ensures that the test results are reliable and valid. If any category has an expected frequency of less than five, the chi-square test may not be appropriate, and alternative methods should be considered.
- Categorical Variables: The chi-square test is specifically designed for analyzing categorical data. If you have quantitative variables, you may need to transform them into categorical variables or use different statistical tests, such as t-tests or ANOVA, depending on the specific research question.
- Independence Assumption: The chi-square test assumes that the observations in each category or cell of the contingency table are independent of each other. In other words, the value of one variable does not depend on or influence the value of the other variable. Violation of this assumption may lead to inaccurate results.
It is important to note that the chi-square test is not appropriate for testing causal relationships or determining the strength of associations. It only assesses the statistical significance of differences or associations between categorical variables.
By considering these guidelines, you can determine whether a chi-square test is suitable for your data analysis and hypothesis testing needs.
advantages of chi-square test
The chi-square test offers several advantages that make it a valuable statistical tool in categorical data analysis. Here are some key advantages of the chi-square test:
- Suitable for Categorical Data: The chi-square test is specifically designed for analyzing categorical data, making it a suitable tool when dealing with variables that have discrete categories or groups.
- Non-parametric Test: The chi-square test is a non-parametric test, which means it does not require assumptions about the underlying distribution of the data. This makes it robust and applicable in situations where the data may not follow a specific distribution.
- Simple and Easy to Understand: The chi-square test is relatively straightforward to understand and implement. It does not involve complex calculations or advanced statistical techniques, making it accessible to researchers and analysts with varying levels of statistical expertise.
- Assessing Independence and Associations: The chi-square test allows for the assessment of independence or associations between categorical variables. It can determine whether there is a significant relationship between two variables or if they are independent of each other.
- Hypothesis Testing: The chi-square test provides a formal framework for hypothesis testing. It allows researchers to test specific hypotheses and make statistical inferences based on the observed data.
- Flexibility: The chi-square test can be applied to different types of categorical data, including goodness-of-fit tests, tests for independence, and tests for homogeneity. This flexibility makes it applicable in various research areas and disciplines.
- Wide Applicability: The chi-square test finds applications in diverse fields such as genetics, social sciences, market research, public health, and more. Its versatility and broad applicability make it a widely used statistical test.
- Provides Test Statistic and P-Value: The chi-square test calculates a test statistic (chi-square value) and a corresponding p-value. These results allow researchers to determine the statistical significance of the relationship or association between variables and make informed conclusions based on the data.
- Can Handle Large Sample Sizes: The chi-square test can handle large sample sizes, making it suitable for analyzing large datasets with numerous categories or groups.
Overall, the chi-square test offers a practical and effective approach for analyzing categorical data, assessing relationships, and conducting hypothesis tests. Its simplicity, flexibility, and wide applicability make it a valuable tool in statistical analysis.
Who uses Chi-Square Test ?
The chi-square test is utilized by researchers, statisticians, and analysts in various fields for analyzing categorical data and investigating relationships between variables. Some specific professionals and domains that commonly use the chi-square test include:
- Social Scientists: Researchers in sociology, psychology, political science, and other social science disciplines employ the chi-square test to examine relationships between categorical variables, such as analyzing survey responses, studying voting patterns, or investigating the association between demographic variables.
- Market Researchers: Professionals in market research and consumer behavior use the chi-square test to analyze data related to consumer preferences, brand loyalty, purchasing behavior, and market segmentation.
- Biologists and Geneticists: The chi-square test is used in genetics to study inheritance patterns, assess genetic linkage, examine allele frequencies, and investigate the association between genetic traits and diseases.
- Public Health Professionals: Epidemiologists and public health researchers use the chi-square test to analyze data related to disease prevalence, risk factors, and outcomes. It helps assess the association between exposure variables and health outcomes in population studies.
- Quality Control Specialists: Professionals involved in quality control and process improvement use the chi-square test to analyze data from defect classification, product inspection, and quality assurance to identify patterns and assess the effectiveness of process improvements.
- Education Researchers: Researchers in education use the chi-square test to examine relationships between variables such as student performance and teaching methods, analyze survey data related to educational attitudes and preferences, and investigate the impact of interventions or programs.
- Environmental Scientists: The chi-square test is used to analyze data in environmental studies, such as examining the relationship between pollution levels and health outcomes, assessing the association between habitat types and species distribution, or analyzing the preferences of individuals regarding environmental policies.
These are just a few examples of the professionals and domains that utilize the chi-square test. Its versatility and applicability to categorical data make it a widely used statistical tool across various disciplines for investigating relationships and associations.
application of chi-square test in business
The chi-square test has several applications in business and market research. Here are some key ways in which the chi-square test is used in the business context:
- Market Segmentation: The chi-square test can be used to analyze categorical data related to customer demographics, preferences, or buying behaviors. It helps identify significant relationships between demographic variables (e.g., age, gender, income) and consumer preferences or purchasing patterns, enabling businesses to tailor their marketing strategies and target specific market segments effectively.
- Brand Loyalty and Customer Satisfaction: By applying the chi-square test, businesses can assess the relationship between customer satisfaction and brand loyalty. Categorical data, such as customer satisfaction ratings and brand loyalty levels, can be analyzed to determine if there is a significant association between these variables. This information can guide businesses in enhancing customer experiences and improving customer retention strategies.
- Market Research Surveys: The chi-square test is commonly used in market research surveys to analyze categorical data. It helps assess the significance of relationships between variables such as customer preferences, brand awareness, product features, or advertising effectiveness. By conducting chi-square tests on survey data, businesses can gain insights into consumer behavior and make data-driven decisions.
- A/B Testing: A/B testing is a technique used by businesses to compare the effectiveness of two or more variations of a product, webpage, or marketing campaign. The chi-square test can be used to analyze categorical data collected during A/B testing to determine if there are significant differences in conversion rates, click-through rates, or other desired outcomes between the variations being tested.
- Employee Satisfaction and Organizational Culture: The chi-square test can be applied to analyze categorical data related to employee satisfaction surveys or assessments of organizational culture. By examining the relationships between variables such as job satisfaction, employee engagement, and organizational values, businesses can identify areas for improvement and develop strategies to enhance employee morale and productivity.
- Quality Control and Process Improvement: In the business context, the chi-square test can be used to analyze categorical data related to quality control, defect classification, or process improvement. It helps assess if there are significant differences in defect frequencies across different production batches, manufacturing lines, or process parameters, enabling businesses to identify areas for quality enhancement and process optimization.
These are just a few examples of how the chi-square test is applied in the business domain. By employing this statistical test, businesses can make informed decisions, develop targeted strategies, and gain insights into the relationships between categorical variables that impact their operations and success.
Conclusion:
The chi-square test is a valuable statistical technique used to analyze categorical data and investigate associations or differences between variables. It enables researchers to draw meaningful conclusions based on observed and expected frequencies.
By understanding the definition, examples, types, and assumptions of the chi-square test, you can confidently apply this method to your own research or data analysis projects.
Remember to assess the independence of observations, consider sample size requirements, and ensure an adequate number of expected frequencies for accurate results.
Other articles
Please read through some of our other articles with examples and explanations if you’d like to learn more about research methodology.
Statistics
Methodology
- Research Methodology MCQ
- Research Methods
- Quantitative Research
- Qualitative Research
- Case Study Research
- Survey Research
- Conclusive Research
- Descriptive Research
- Cross-Sectional Research
- Theoretical Framework
- Conceptual Framework
- Triangulation
- Grounded Theory
- Quasi-Experimental Design
- Mixed Method
- Correlational Research
- Randomized Controlled Trial
- Stratified Sampling
- Ethnography
- Ghost Authorship
- Secondary Data Collection
- Primary Data Collection
- Ex-Post-Facto
Research
- Table of Contents
- Dissertation Topic
- Synopsis
- Thesis Statement
- Research Proposal
- Research Questions
- Research Problem
- Research Gap
- Types of Research Gaps
- Variables
- Operationalization of Variables
- Literature Review
- Research Hypothesis
- Questionnaire
- Abstract
- Validity
- Reliability
- Measurement of Scale
- Sampling Techniques
- Acknowledgements


