

When analyzing data and conducting statistical tests, one commonly used tool is the t-test. The t-test is a hypothesis test that allows us to compare the means of two groups or determine if a sample mean differs significantly from a population mean.
In this blog post, we will explore the definition of the t-test, provide an example to illustrate its application, explain the formula behind it, and discuss when to use a t-test.
T-test
The t-test is a statistical test that helps us determine if there is a significant difference between the means of two groups. It assesses whether the observed difference in means is likely due to random sampling variation or if it represents a true difference in the population.
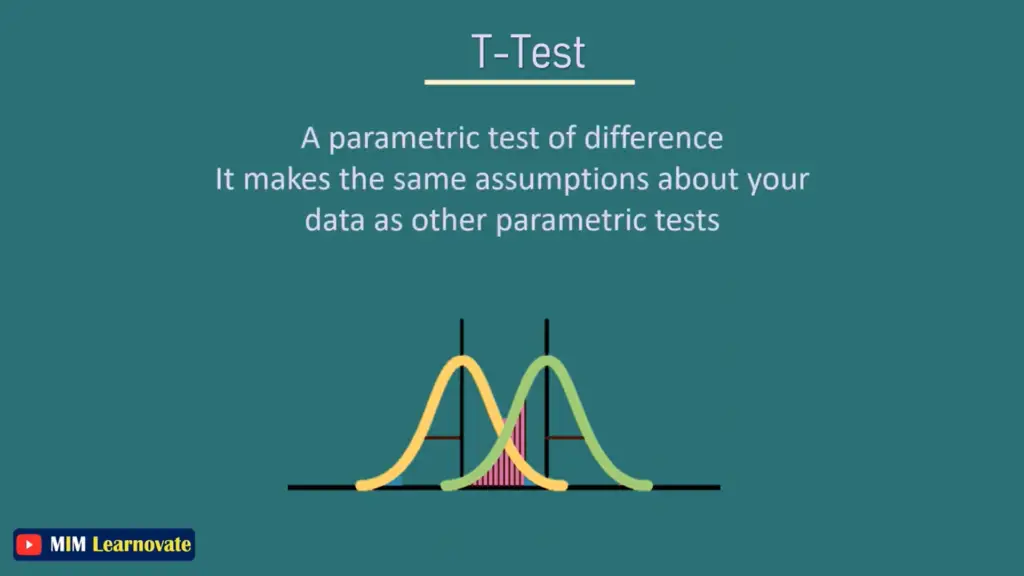
It is frequently employed in hypothesis testing to establish whether a process or treatment truly affects the population of interest or whether two groups differ from one another.
The t-test takes into account both the sample means and the variability within the groups to make this determination.
Example of T-test
Let’s consider an example to better understand the application of a t-test.
Imagine a researcher wants to investigate whether there is a significant difference in the mean scores of two different groups of students (Group A and Group B) on a math test.
The researcher collects data from both groups and wants to determine if the observed difference in mean scores is statistically significant.
Read More: Chi-Square Test (Χ²) || Examples, Types, and Assumptions
Hypothesis
- Null hypothesis (H0): There is no significant difference between the mean scores of Group A and Group B.
- Alternative hypothesis (Ha): There is a significant difference between the mean scores of Group A and Group B.
The t-test will help us evaluate these hypotheses and determine if there is evidence to support the alternative hypothesis.
Formula of a T-test
The t-test calculates a test statistic (t-value) based on the sample means, sample sizes, and sample variances of the two groups. The formula for the t-value depends on the type of t-test being conducted. The most common types of t-tests are the independent samples t-test and the paired samples t-test.
The independent samples t-test is used when comparing the means of two independent groups, while the paired samples t-test is used when comparing means of related or paired observations.
For the independent samples t-test, the formula for calculating the t-value is:
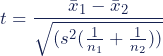
Where:
- X1 and X2 are the sample means of Group A and Group B, respectively.
- s2 is the pooled standard error of the Group A and Group B, respectively.
- n1 and n2 are the number of observations of Group A and Group B, respectively.
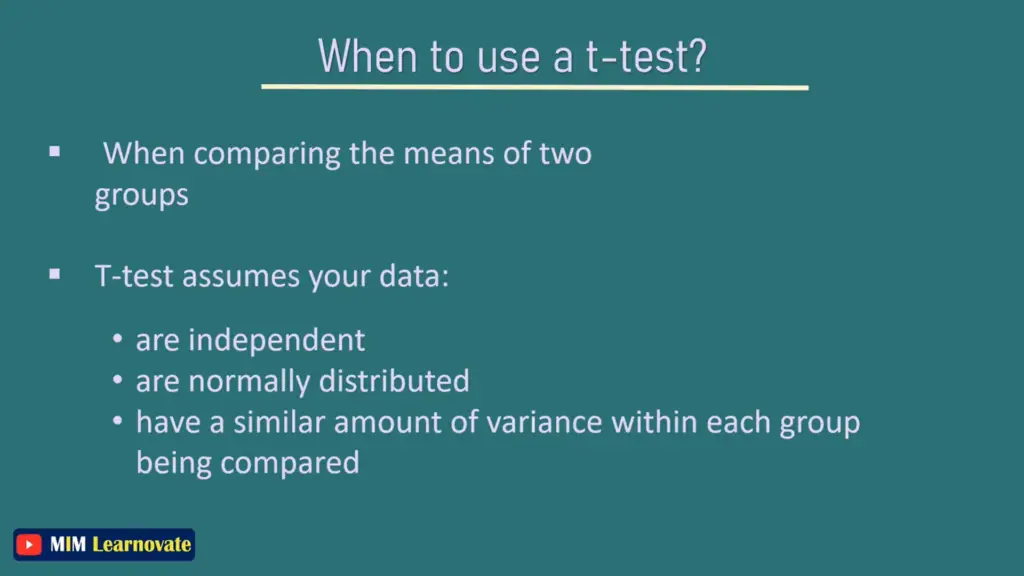
When to Use a T-test?
The t-test is useful in various scenarios, including:
- Comparing means of two independent groups: Use an independent samples t-test when you want to compare the means of two groups that are independent of each other (e.g., treatment vs. control group, male vs. female).
- Analyzing paired data: Use a paired samples t-test when you want to compare means of related or paired observations (e.g., pre-test vs. post-test scores, matched pairs).
- Working with continuous numerical data: The t-test is appropriate for analyzing data with continuous numerical variables.
It is frequently employed in hypothesis testing to establish whether a process or treatment truly affects the population of interest or whether two groups differ from one another.
When selecting a t test, you must consider two factors:
- whether the groups being compared are from the same population or two different populations
- whether you want to test the difference in a specific direction.
What type of t-test should I use, One-sample, two-sample, or paired t test?
There are three main types of t-tests:
Independent Samples T-Test:
- Use this test when you want to compare the means of two independent groups or conditions.
- Use a two-sample t test (also known as an independent t test) if the groups are from two different populations (for example, two different species or people from two different towns). This is a between-subjects design.
- Example: Comparing the average test scores of students who received a particular intervention (Group A) with those who did not receive the intervention (Group B).
Paired Samples T-Test:
- Use this test when you have paired or matched observations or measurements within the same group.
- Use a paired t test if the groups are drawn from a single population (for instance, when assessing before and after an experimental treatment). This design is within-subjects.
- Example: Comparing the pre- and post-treatment scores of the same group of participants to determine if there is a significant change.
One-Sample T-Test:
- Use this test when you want to compare the mean of a single group to a known population mean or a hypothesized value.
- Use a one-sample t test for comparing one group to a standard value (such as when comparing a liquid’s acidity to a neutral pH of 7).
- Example: Determining if the average height of a sample of individuals is significantly different from the average height of the general population.
To decide which type of t-test to use, consider the nature of your data and the research question you are trying to answer.
If you have two independent groups or conditions that you want to compare, use the independent samples t-test. If you have paired or matched measurements within the same group, the paired samples t-test is appropriate.
Lastly, if you want to compare a single group to a known value or population mean, the one-sample t-test is suitable.
Which t test has two or one tails?
Use a two-tailed t test if the only thing that matters is if the two populations differ from one another.
Use a one-tailed t test to determine whether one population mean is greater or less than the other.
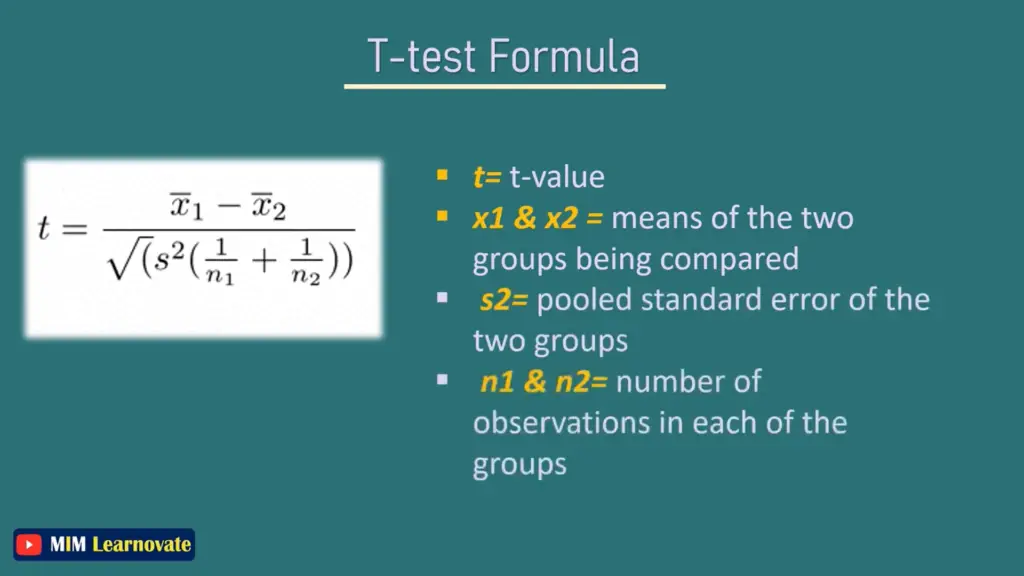
It’s important to note that the t-test assumes that the data follow a normal distribution and that the variances between groups are approximately equal. Violation of these assumptions may affect the validity of the test results.
Example of Two Sample t-test
In your test to see if petal length varies by species:
Because your observations come from two separate populations (different species), you do a two-sample t test.
You don’t care about the direction of the difference, only that there is one, therefore you use a two-tailed t test.
Conclusion
In conclusion, the t-test is a valuable statistical tool for comparing means and determining if there is a significant difference between groups. By understanding its definition, formula, and appropriate use cases, researchers can make informed decisions when conducting hypothesis tests. The t-test provides a reliable method to analyze data and draw meaningful conclusions, aiding in the advancement of scientific research and decision-making processes.
Other articles
Please read through some of our other articles with examples and explanations if you’d like to learn more.
Statistics
- PLS-SEM model
- Principal Components Analysis
- Multivariate Analysis
- Friedman Test
- Chi-Square Test (Χ²)
- T-test
- SPSS
- Effect Size
- Critical Values in Statistics
- Statistical Analysis
- Calculate the Sample Size for Randomized Controlled Trials
- Covariate in Statistics
- Avoid Common Mistakes in Statistics
- Standard Deviation
- Derivatives & Formulas
- Build a PLS-SEM model using AMOS
- Principal Components Analysis using SPSS
- Statistical Tools
- Type I vs Type II error
- Descriptive and Inferential Statistics
- Microsoft Excel and SPSS
- One-tailed and Two-tailed Test
- Parametric and Non-Parametric Test
Citation Styles
Comparision
- Independent vs. Dependent Variable – MIM Learnovate
- Research Article and Research Paper
- Proposition and Hypothesis
- Principal Component Analysis and Partial Least Squares
- Academic Research vs Industry Research
- Clinical Research vs Lab Research
- Research Lab and Hospital Lab
- Thesis Statement and Research Question
- Quantitative Researchers vs. Quantitative Traders
- Premise, Hypothesis and Supposition
- Survey Vs Experiment
- Hypothesis and Theory
- Independent vs. Dependent Variable
- APA vs. MLA
- Ghost Authorship vs. Gift Authorship
- Basic and Applied Research
- Cross-Sectional vs Longitudinal Studies
- Survey vs Questionnaire
- Open Ended vs Closed Ended Questions
- Experimental and Non-Experimental Research
- Inductive vs Deductive Approach
- Null and Alternative Hypothesis
- Reliability vs Validity
- Population vs Sample
- Conceptual Framework and Theoretical Framework
- Bibliography and Reference
- Stratified vs Cluster Sampling
- Sampling Error vs Sampling Bias
- Internal Validity vs External Validity
- Full-Scale, Laboratory-Scale and Pilot-Scale Studies
- Plagiarism and Paraphrasing
- Research Methodology Vs. Research Method
- Mediator and Moderator
- Type I vs Type II error
- Descriptive and Inferential Statistics
- Microsoft Excel and SPSS
- Parametric and Non-Parametric Test
Research
- Table of Contents
- Dissertation Topic
- Synopsis
- Thesis Statement
- Research Proposal
- Research Questions
- Research Problem
- Research Gap
- Types of Research Gaps
- Variables
- Operationalization of Variables
- Literature Review
- Research Hypothesis
- Questionnaire
- Abstract
- Validity
- Reliability
- Measurement of Scale
- Sampling Techniques
- Acknowledgements
- Research Methods
- Quantitative Research
- Qualitative Research
- Case Study Research
- Survey Research
- Conclusive Research
- Descriptive Research
- Cross-Sectional Research
- Theoretical Framework
- Conceptual Framework
- Triangulation
- Grounded Theory
- Quasi-Experimental Design
- Mixed Method
- Correlational Research
- Randomized Controlled Trial
- Stratified Sampling
- Ethnography
- Ghost Authorship
- Secondary Data Collection
- Primary Data Collection
- Ex-Post-Facto