Microsoft Excel and SPSS (Statistical Package for the Social Sciences) are two popular software tools used for data analysis and management.
While they both have their strengths, there are several key differences between them. In this blog post, we will explore the major differences between Microsoft Excel and SPSS to help you understand which tool may be more suitable for your specific data analysis needs.
SPSS
The “Statistical Package for the Social Sciences” (SPSS) was introduced in 1968. The official name of SPSS was changed to IBM SPSS Statistics in 2009 after IBM bought SPSS. However, it was discovered that a lot of people still just called it “SPSS.”
Bivariate and descriptive statistics, group predictions, and numerical result predictions are all used in data analysis with SPSS. Additionally, it uses graphing features, direct marketing, and data transformation.
Read More: A Useful Guide On Statistical Package For The Social Sciences [SPSS]
Excel
One of the most capable and user-friendly statistical software software is Excel. It enables storing of data in a tabular format, or in rows and columns.
You can use some of the most effective formulas to sort and filter the data. Excel’s pivot tables function is its best feature. By modifying the data, you can use pivot tables to get new insights.
There are many options in Excel that can assist you with statistics. The data can be imported and exported in a variety of ways. The data can also be included in the workflow.
Excel’s programming abilities let you develop the own function unlike any other statistics software.
Excel’s main function is to record data and modify that data to meet the needs of the user. Excel enables you to analyze, create reports, and perform other tasks using the external database.
The best graphical user interface today, combined with the usage of graphics tools and visualisation techniques, are all provided by Excel.
Differences Between Microsoft Excel and SPSS
1. Excel Vs SPSS: Data Analysis Capabilities
- Microsoft Excel: Excel is primarily a spreadsheet application that offers basic data analysis functionalities. It provides essential statistical functions, such as mean, median, and standard deviation. It also supports simple charts and graphs for data visualization.
- SPSS: SPSS is specifically designed for statistical analysis. It offers a wide range of advanced statistical procedures, including regression analysis, factor analysis, t-tests, ANOVA, and more. SPSS provides an extensive set of tools for data exploration, hypothesis testing, and model building.
2. Excel Vs SPSS: Data Handling and Management
- Microsoft Excel: Excel is widely used for data storage and basic data manipulation. It allows users to organize data in spreadsheets, apply formatting, and perform simple data cleaning tasks. Excel is suitable for small to medium-sized datasets.
- SPSS: SPSS is built to handle larger datasets efficiently. It provides powerful data management capabilities, including data merging, variable transformation, and missing data handling. SPSS supports both numerical and categorical data types, making it well-suited for analyzing complex datasets.
3: Excel Vs SPSS: Data Visualization
- Microsoft Excel: Excel offers a range of chart types and visualization options to represent data. Users can create basic charts like bar graphs, line charts, and pie charts. Excel provides customization options for colors, labels, and titles to enhance visual presentation.
- SPSS: SPSS provides advanced data visualization features, including interactive charts, scatterplots, box plots, and more. It offers greater flexibility in customizing visual elements and supports more sophisticated data visualizations for detailed analysis and reporting.
4. Excel Vs SPSS: Statistical Analysis and Reporting
- Microsoft Excel: Excel’s statistical analysis capabilities are limited compared to SPSS. It is suitable for simple analyses and quick calculations. However, Excel lacks the robustness and depth of statistical procedures that SPSS provides. Reporting features in Excel require manual creation and customization.
- SPSS: SPSS is specifically designed for statistical analysis and reporting. It offers a comprehensive set of statistical tests and procedures, allowing users to perform complex analyses and generate detailed reports. SPSS provides customizable templates and automated reporting options for easy presentation of results.
5. Excel Vs SPSS: Learning Curve and Accessibility
- Microsoft Excel: Excel is widely used and familiar to many users due to its broad adoption. Its user-friendly interface and basic functionalities make it accessible to users of all skill levels. Excel is readily available as part of the Microsoft Office suite.
- SPSS: SPSS has a steeper learning curve, especially for users with limited statistical knowledge. It requires a basic understanding of statistical concepts and familiarity with its interface. SPSS is a specialized software package that needs to be purchased separately.
Microsoft Excel Vs SPSS
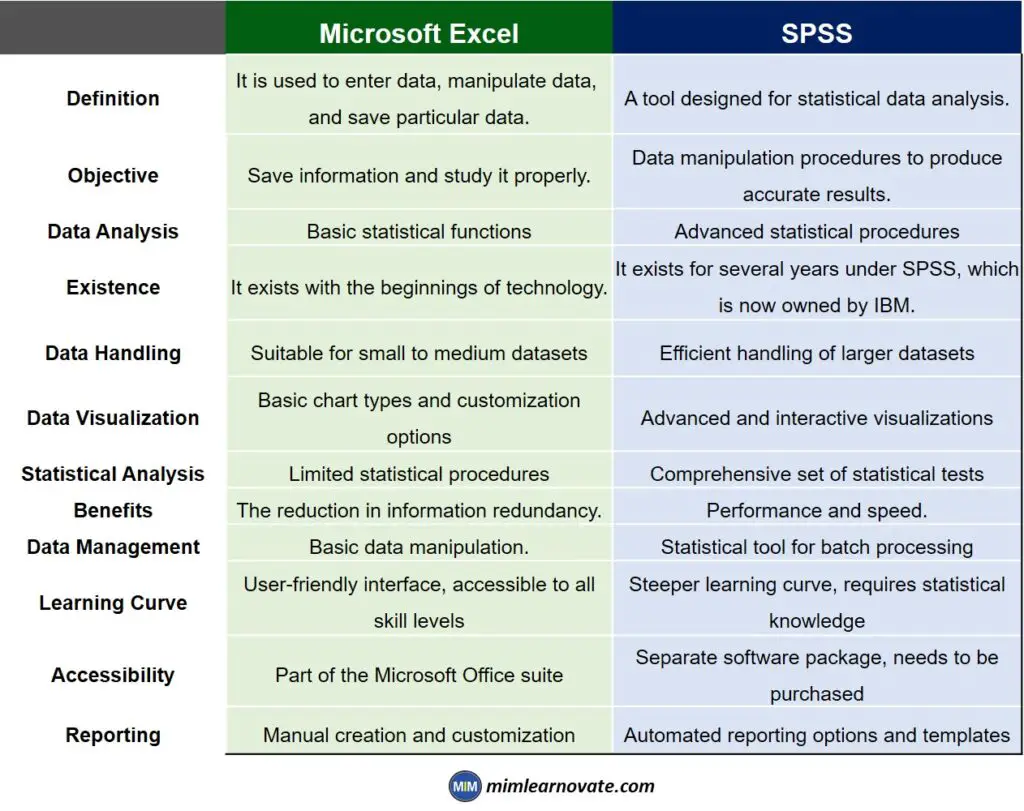
| Feature | Microsoft Excel | SPSS |
|---|---|---|
| Definition | It is used to enter data, manipulate data, and save particular data. | A tool designed for statistical data analysis. |
| Objective | Save information and study it properly. | Data manipulation procedures to produce accurate results. |
| Data Analysis | Basic statistical functions | Advanced statistical procedures |
| Existence | It exists with the beginnings of technology. | It exists for several years under SPSS, which is now owned by IBM. |
| Data Handling | Suitable for small to medium datasets | Efficient handling of larger datasets |
| Data Visualization | Basic chart types and customization options | Advanced and interactive visualizations |
| Statistical Analysis | Limited statistical procedures | Comprehensive set of statistical tests |
| Benefits | The reduction in information redundancy. | Performance and speed. |
| Data Management | Basic data manipulation. | Statistical tool for batch processing |
| Learning Curve | User-friendly interface, accessible to all skill levels | Steeper learning curve, requires statistical knowledge |
| Accessibility | Part of the Microsoft Office suite | Separate software package, needs to be purchased |
| Reporting | Manual creation and customization | Automated reporting options and templates |

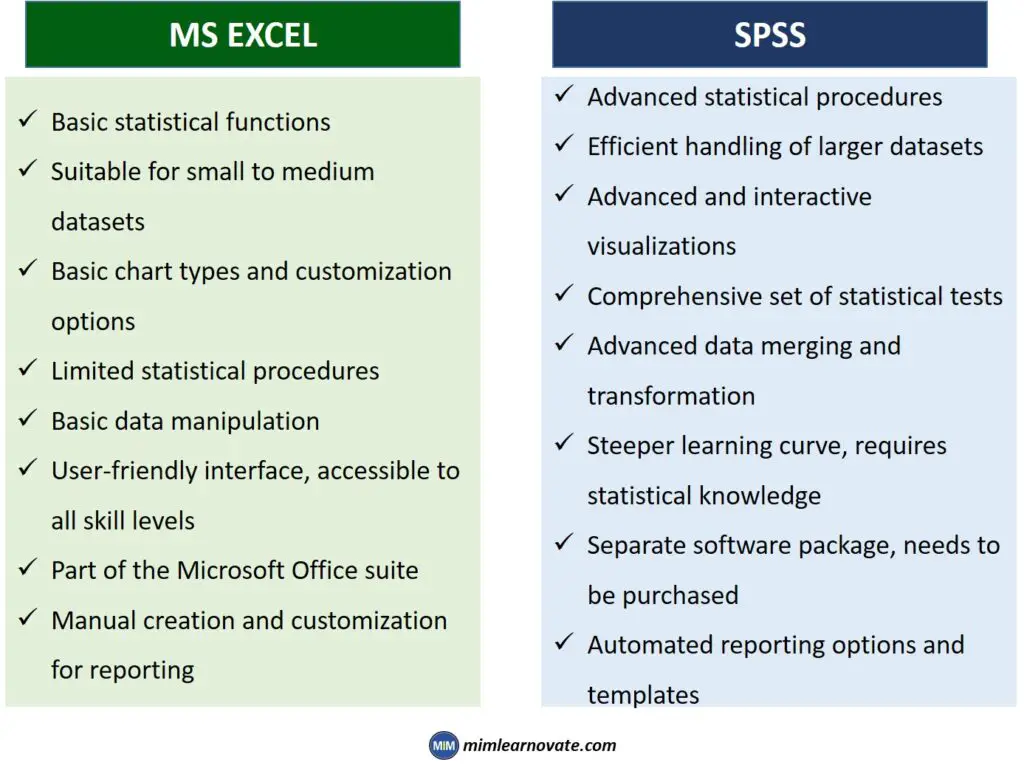
Microsoft Excel Vs SPSS: Advantages

Microsoft Excel Vs SPSS: Which one is better?
Both Microsoft Excel and SPSS have their strengths and purposes. Excel is a versatile tool for basic data analysis and general spreadsheet tasks. It is suitable for small datasets and quick calculations.
On the other hand, SPSS is a comprehensive statistical package specifically designed for data analysis, with advanced statistical procedures and robust data management capabilities.
If you work with large datasets and require advanced statistical analysis, SPSS is the preferred choice. However, for simpler tasks and basic data manipulation, Excel can be a suitable option.
Consider your specific data analysis needs, the complexity of your dataset, and the level of statistical analysis required to determine which tool is best suited for your project
Read More: A Useful Guide On Statistical Package For The Social Sciences [SPSS]
Other articles
Please read through some of our other articles with examples and explanations if you’d like to learn more about research methodology.
Citation Styles
- APA Reference Page
- MLA Citations
- Chicago Style Format
- “et al.” in APA, MLA, and Chicago Style
- Do All References in a Reference List Need to Be Cited in Text?
Comparision
- Basic and Applied Research
- Cross-Sectional vs Longitudinal Studies
- Survey vs Questionnaire
- Open Ended vs Closed Ended Questions
- Experimental and Non-Experimental Research
- Inductive vs Deductive Approach
- Null and Alternative Hypothesis
- Reliability vs Validity
- Population vs Sample
- Conceptual Framework and Theoretical Framework
- Bibliography and Reference
- Stratified vs Cluster Sampling
- Sampling Error vs Sampling Bias
- Internal Validity vs External Validity
- Full-Scale, Laboratory-Scale and Pilot-Scale Studies
- Plagiarism and Paraphrasing
- Research Methodology Vs. Research Method
- Mediator and Moderator
- Type I vs Type II error
- Descriptive and Inferential Statistics
- Microsoft Excel and SPSS
- Parametric and Non-Parametric Test
Comparision
- Independent vs. Dependent Variable – MIM Learnovate
- Research Article and Research Paper
- Proposition and Hypothesis
- Principal Component Analysis and Partial Least Squares
- Academic Research vs Industry Research
- Clinical Research vs Lab Research
- Research Lab and Hospital Lab
- Thesis Statement and Research Question
- Quantitative Researchers vs. Quantitative Traders
- Premise, Hypothesis and Supposition
- Survey Vs Experiment
- Hypothesis and Theory
- Independent vs. Dependent Variable
- APA vs. MLA
- Ghost Authorship vs. Gift Authorship
Research
- Research Methods
- Quantitative Research
- Qualitative Research
- Case Study Research
- Survey Research
- Conclusive Research
- Descriptive Research
- Cross-Sectional Research
- Theoretical Framework
- Conceptual Framework
- Triangulation
- Grounded Theory
- Quasi-Experimental Design
- Mixed Method
- Correlational Research
- Randomized Controlled Trial
- Stratified Sampling
- Ethnography
- Ghost Authorship
- Secondary Data Collection
- Primary Data Collection
- Ex-Post-Facto
Research
- Table of Contents
- Dissertation Topic
- Synopsis
- Thesis Statement
- Research Proposal
- Research Questions
- Research Problem
- Research Gap
- Types of Research Gaps
- Variables
- Operationalization of Variables
- Literature Review
- Research Hypothesis
- Questionnaire
- Abstract
- Validity
- Reliability
- Measurement of Scale
- Sampling Techniques
- Acknowledgements
Statistics
- PLS-SEM model
- Principal Components Analysis
- Multivariate Analysis
- Friedman Test
- Chi-Square Test (Χ²)
- T-test
- SPSS
- Effect Size
- Critical Values in Statistics
- Statistical Analysis
- Calculate the Sample Size for Randomized Controlled Trials
- Covariate in Statistics
- Avoid Common Mistakes in Statistics
- Standard Deviation
- Derivatives & Formulas
- Build a PLS-SEM model using AMOS
- Principal Components Analysis using SPSS
- Statistical Tools
- Type I vs Type II error
- Descriptive and Inferential Statistics
- Microsoft Excel and SPSS
- One-tailed and Two-tailed Test
- Parametric and Non-Parametric Test


