

In the quick-paced world of today, statistics is becoming increasingly important in the field of research; it aids in the gathering, processing, and presentation of data in a way that is measurable.
Given that most individuals are unfamiliar with these two disciplines of statistics, it can be difficult to determine if a study uses descriptive or inferential statistics.
While both serve important roles in understanding and summarizing data, they differ in their objectives, methods, and interpretations.
In this blog post, we will explore the key differences between descriptive and inferential statistics.
Descriptive Statistics
Descriptive statistics involves organizing, summarizing, and presenting data in a meaningful way. Its main purpose is to describe and depict the characteristics of a dataset.
features of descriptive statistics
Here are some key features of descriptive statistics:
- Objective: Descriptive statistics aims to provide a clear and concise summary of data. It focuses on describing the main features, patterns, and trends within a dataset.
- Data Analysis Techniques: Descriptive statistics employs measures such as measures of central tendency (e.g., mean, median, mode) and measures of dispersion (e.g., range, variance, standard deviation) to quantify and describe the data.
- Sample Representativeness: Descriptive statistics is typically applied to a sample of data, which is assumed to be representative of a larger population. It helps researchers summarize and understand the characteristics of the sample.
- Interpretation: Descriptive statistics allows researchers to interpret and communicate the main findings and properties of the dataset to a general audience. It provides a summary that can be easily understood and interpreted without making inferences beyond the observed data.
Inferential Statistics
Inferential statistics, on the other hand, involves making inferences or generalizations about a population based on a sample of data. It uses statistical methods to draw conclusions or make predictions about a larger group.
features of inferential statistics
Here are some key features of inferential statistics:
- Objective: Inferential statistics aims to make inferences or generalizations about a population based on the analysis of a sample. It extends the findings from the sample to the larger population and investigates relationships, causality, and predictions.
- Data Analysis Techniques: Inferential statistics employs techniques such as hypothesis testing, confidence intervals, and regression analysis to draw conclusions and make predictions. It assesses the likelihood of observing certain patterns or relationships in the population based on the sample data.
- Population Inference: Inferential statistics focuses on drawing conclusions about the larger population from which the sample was taken. It allows researchers to make statements about the population parameters and assess the significance of relationships or differences.
- Interpretation: Inferential statistics provides insights beyond the observed data. It allows researchers to make predictions, test hypotheses, and generalize findings to a larger population. The results are presented with measures of confidence or probability to assess the validity and reliability of the inferences.
Difference between Descriptive and Inferential Statistics
These factors make it easy to differentiate between descriptive and inferential statistics:
- The goal of descriptive statistics is to provide a detailed description of the population being studied. A type of statistics known as inferential statistics concentrates on inferring information about the population from sample analysis and observation.
- Descriptive statistics collects, organizes, analyses, and presents data in a comprehensible way. Inferential statistics, on the other hand, compares data, tests hypotheses, and forecasts future results.
- In descriptive statistics, the final result is shown via diagrams or tabularly, whereas the final result is displayed in the form of probability.
- While inferential statistics explains the likelihood of an event occurring, descriptive statistics depicts a condition.
- To summarize the sample, descriptive statistics describes the data that is previously known. In contrast, inferential statistics seeks to draw conclusions about the population that go beyond the scope of the data at hand.
Descriptive Statistics Vs Inferential Statistics
| Descriptive Statistics | Inferential Statistics | |
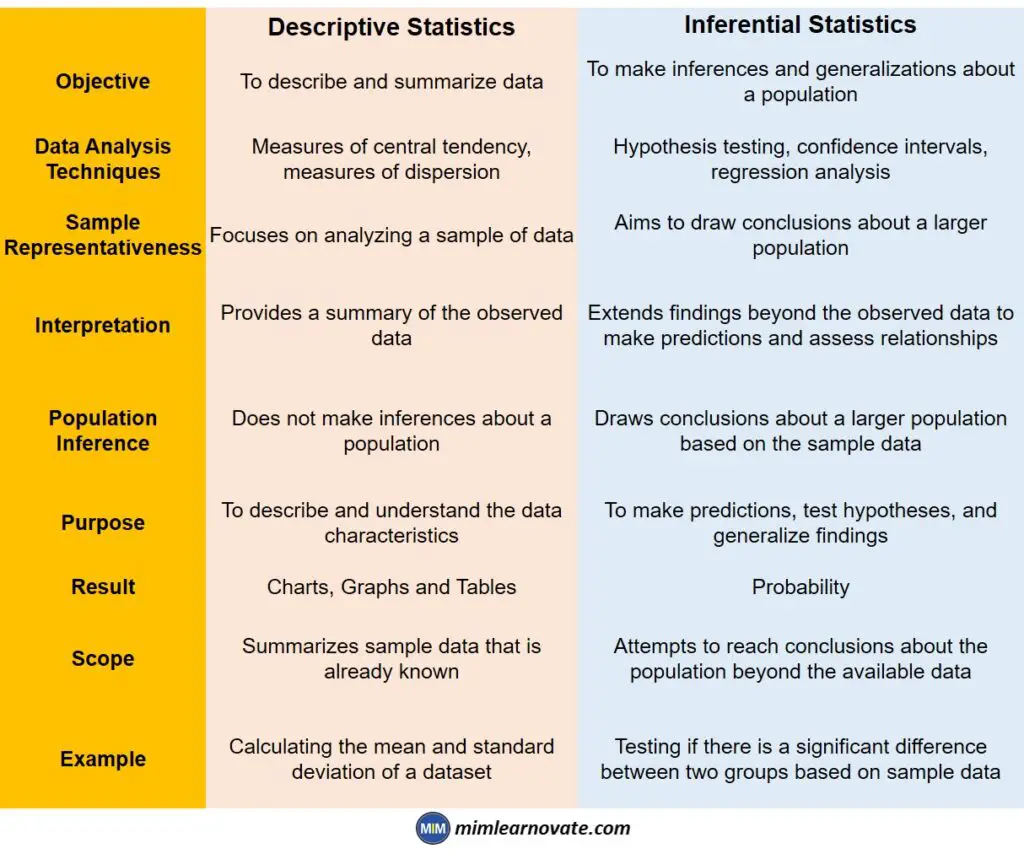
| Objective | To describe and summarize data | To make inferences and generalizations about a population |
| Data Analysis Techniques | Measures of central tendency, measures of dispersion | Hypothesis testing, confidence intervals, regression analysis |
| Sample Representativeness | Focuses on analyzing a sample of data | Aims to draw conclusions about a larger population |
| Interpretation | Provides a summary of the observed data | Extends findings beyond the observed data to make predictions and assess relationships |
| Population Inference | Does not make inferences about a population | Draws conclusions about a larger population based on the sample data |
| Purpose | To describe and understand the data characteristics | To make predictions, test hypotheses, and generalize findings |
| Result | Charts, Graphs and Tables | Probability |
| Scope | Summarizes sample data that is already known | Attempts to reach conclusions about the population beyond the available data |
| Example | Calculating the mean and standard deviation of a dataset | Testing if there is a significant difference between two groups based on sample data |
Conclusion
Descriptive and inferential statistics are essential components of statistical analysis, serving distinct purposes in the research process. Descriptive statistics summarizes and describes the features of a dataset, while inferential statistics draws conclusions, makes predictions, and generalizes findings to a larger population.
By understanding the difference between descriptive and inferential statistics, researchers can appropriately choose and apply the appropriate techniques based on their research objectives and the nature of the data. Both types of statistics contribute to a comprehensive understanding of data, enabling researchers to uncover insights, make informed decisions, and contribute to evidence-based knowledge in their respective fields.
Other articles
Please read through some of our other articles with examples and explanations if you’d like to learn more.
Statistics
- PLS-SEM model
- Principal Components Analysis
- Multivariate Analysis
- Friedman Test
- Chi-Square Test (Χ²)
- T-test
- SPSS
- Effect Size
- Critical Values in Statistics
- Statistical Analysis
- Calculate the Sample Size for Randomized Controlled Trials
- Covariate in Statistics
- Avoid Common Mistakes in Statistics
- Standard Deviation
- Derivatives & Formulas
- Build a PLS-SEM model using AMOS
- Principal Components Analysis using SPSS
- Statistical Tools
- Type I vs Type II error
- Descriptive and Inferential Statistics
- Microsoft Excel and SPSS
- One-tailed and Two-tailed Test
- Parametric and Non-Parametric Test
Citation Styles
Comparision
- Independent vs. Dependent Variable
- Research Article and Research Paper
- Proposition and Hypothesis
- Principal Component Analysis and Partial Least Squares
- Academic Research vs Industry Research
- Clinical Research vs Lab Research
- Research Lab and Hospital Lab
- Thesis Statement and Research Question
- Quantitative Researchers vs. Quantitative Traders
- Premise, Hypothesis and Supposition
- Survey Vs Experiment
- Hypothesis and Theory
- Independent vs. Dependent Variable
- APA vs. MLA
- Ghost Authorship vs. Gift Authorship
- Basic and Applied Research
- Cross-Sectional vs Longitudinal Studies
- Survey vs Questionnaire
- Open Ended vs Closed Ended Questions
- Experimental and Non-Experimental Research
- Inductive vs Deductive Approach
- Null and Alternative Hypothesis
- Reliability vs Validity
- Population vs Sample
- Conceptual Framework and Theoretical Framework
- Bibliography and Reference
- Stratified vs Cluster Sampling
- Sampling Error vs Sampling Bias
- Internal Validity vs External Validity
- Full-Scale, Laboratory-Scale and Pilot-Scale Studies
- Plagiarism and Paraphrasing
- Research Methodology Vs. Research Method
- Mediator and Moderator
- Type I vs Type II error
- Descriptive and Inferential Statistics
- Microsoft Excel and SPSS
- Parametric and Non-Parametric Test
Research
- Table of Contents
- Dissertation Topic
- Synopsis
- Thesis Statement
- Research Proposal
- Research Questions
- Research Problem
- Research Gap
- Types of Research Gaps
- Variables
- Operationalization of Variables
- Literature Review
- Research Hypothesis
- Questionnaire
- Abstract
- Validity
- Reliability
- Measurement of Scale
- Sampling Techniques
- Acknowledgements
- Research Methods
- Quantitative Research
- Qualitative Research
- Case Study Research
- Survey Research
- Conclusive Research
- Descriptive Research
- Cross-Sectional Research
- Theoretical Framework
- Conceptual Framework
- Triangulation
- Grounded Theory
- Quasi-Experimental Design
- Mixed Method
- Correlational Research
- Randomized Controlled Trial
- Stratified Sampling
- Ethnography
- Ghost Authorship
- Secondary Data Collection
- Primary Data Collection
- Ex-Post-Facto